← All templates
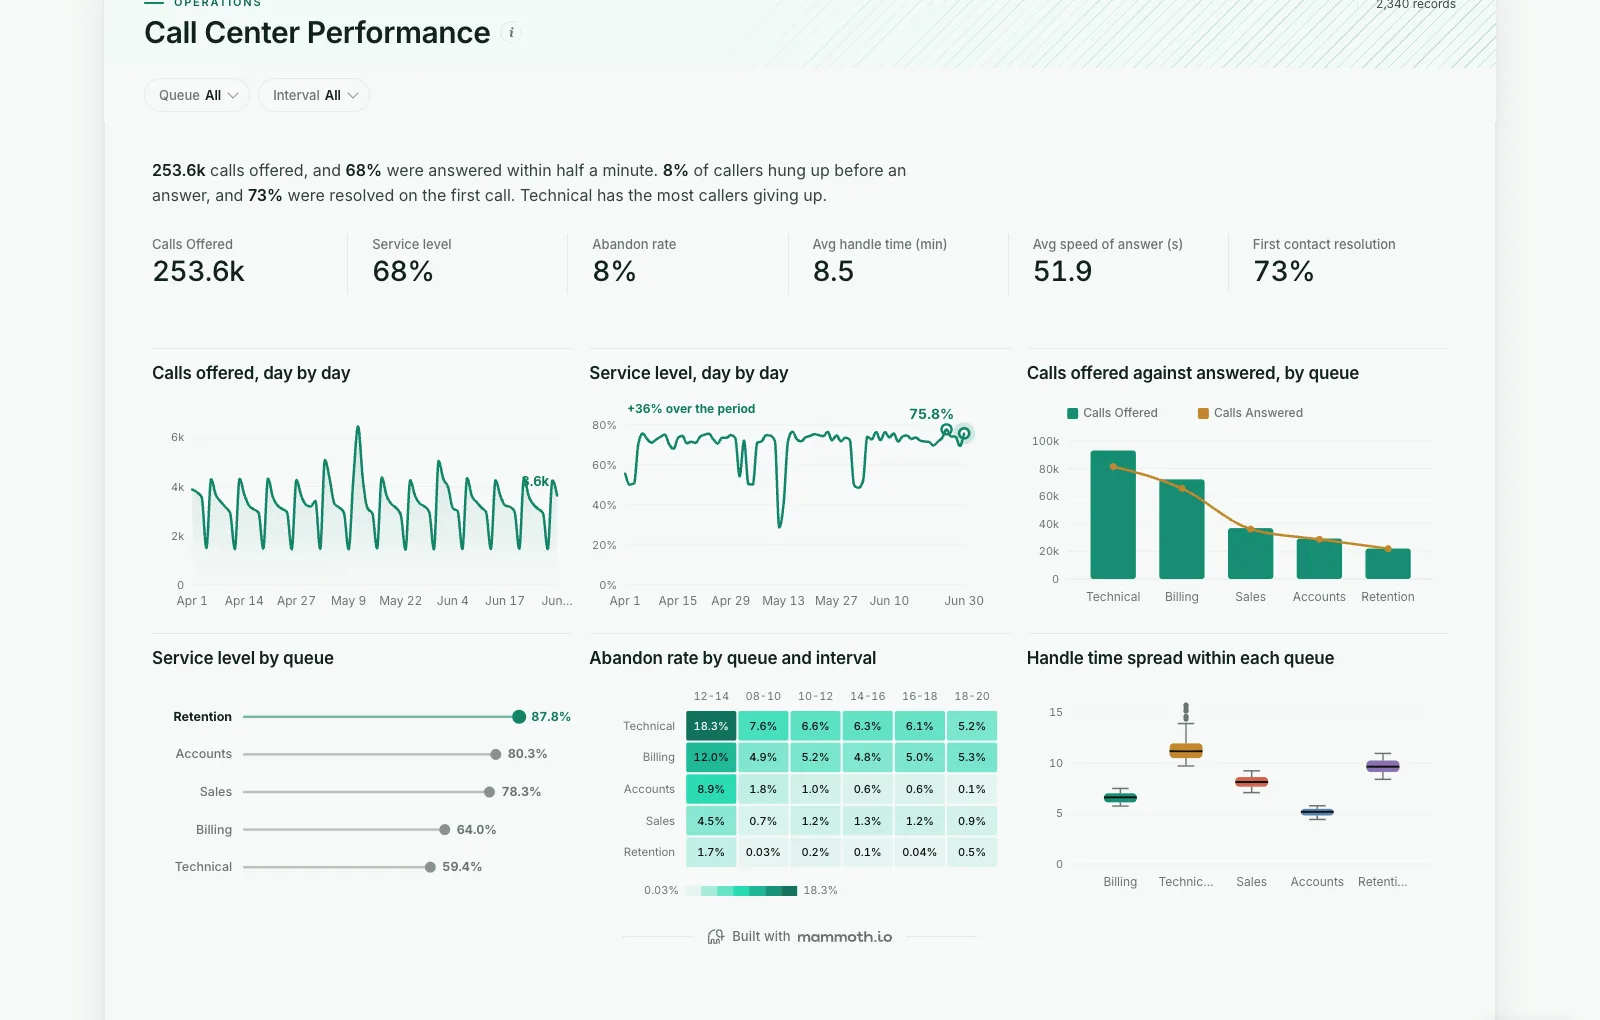
Shown on sample data. The figures are illustrative, not real business results — take the template and point it at your own.
Call Center Performance
Are calls answered fast enough, how many callers give up, and where does demand outrun the staff?
DashboardOperationsAny industryWhat it needs from your data
| Needs | a numeric amount, a category (~5 values) |
|---|---|
| Optional | dates for trends, 9 more |
What is on it
- Calls offered, day by day Area chart
- Service level, day by day Line chart
- Calls offered against answered, by queue Combo chart
- Service level by queue Ranking chart
- Abandon rate by queue and interval Heatmap
- Handle time spread within each queue Box plot