Dashboard templates
Ready-made dashboards, documents and decks. Every one opens on real sample data, so you can see the finished output before you bring your own — then point it at your data and keep the layout.
Google Ads Performance
Your Google Ads campaigns: what you spent, the conversions it bought, what they were worth and what each one cost. Connect Google Ads and it fills in from your account.
DashboardMarketingGoogle AdsJira Issues
Your Jira issues: what each team opened and finished, the story points completed sprint by sprint, how long issues take and the bugs still open. Connect Jira and it fills in from your account.
DashboardProjectJiraSales Performance
Deal value by rep, region and product, and how the book is trending.
DashboardSalesAny industryCustomer Support
Your Zendesk tickets: how many came in and got solved, how fast customers hear back and get an answer, and how happy they are. Connect Zendesk and it fills in from your account.
DashboardOperationsZendeskInstagram Posts
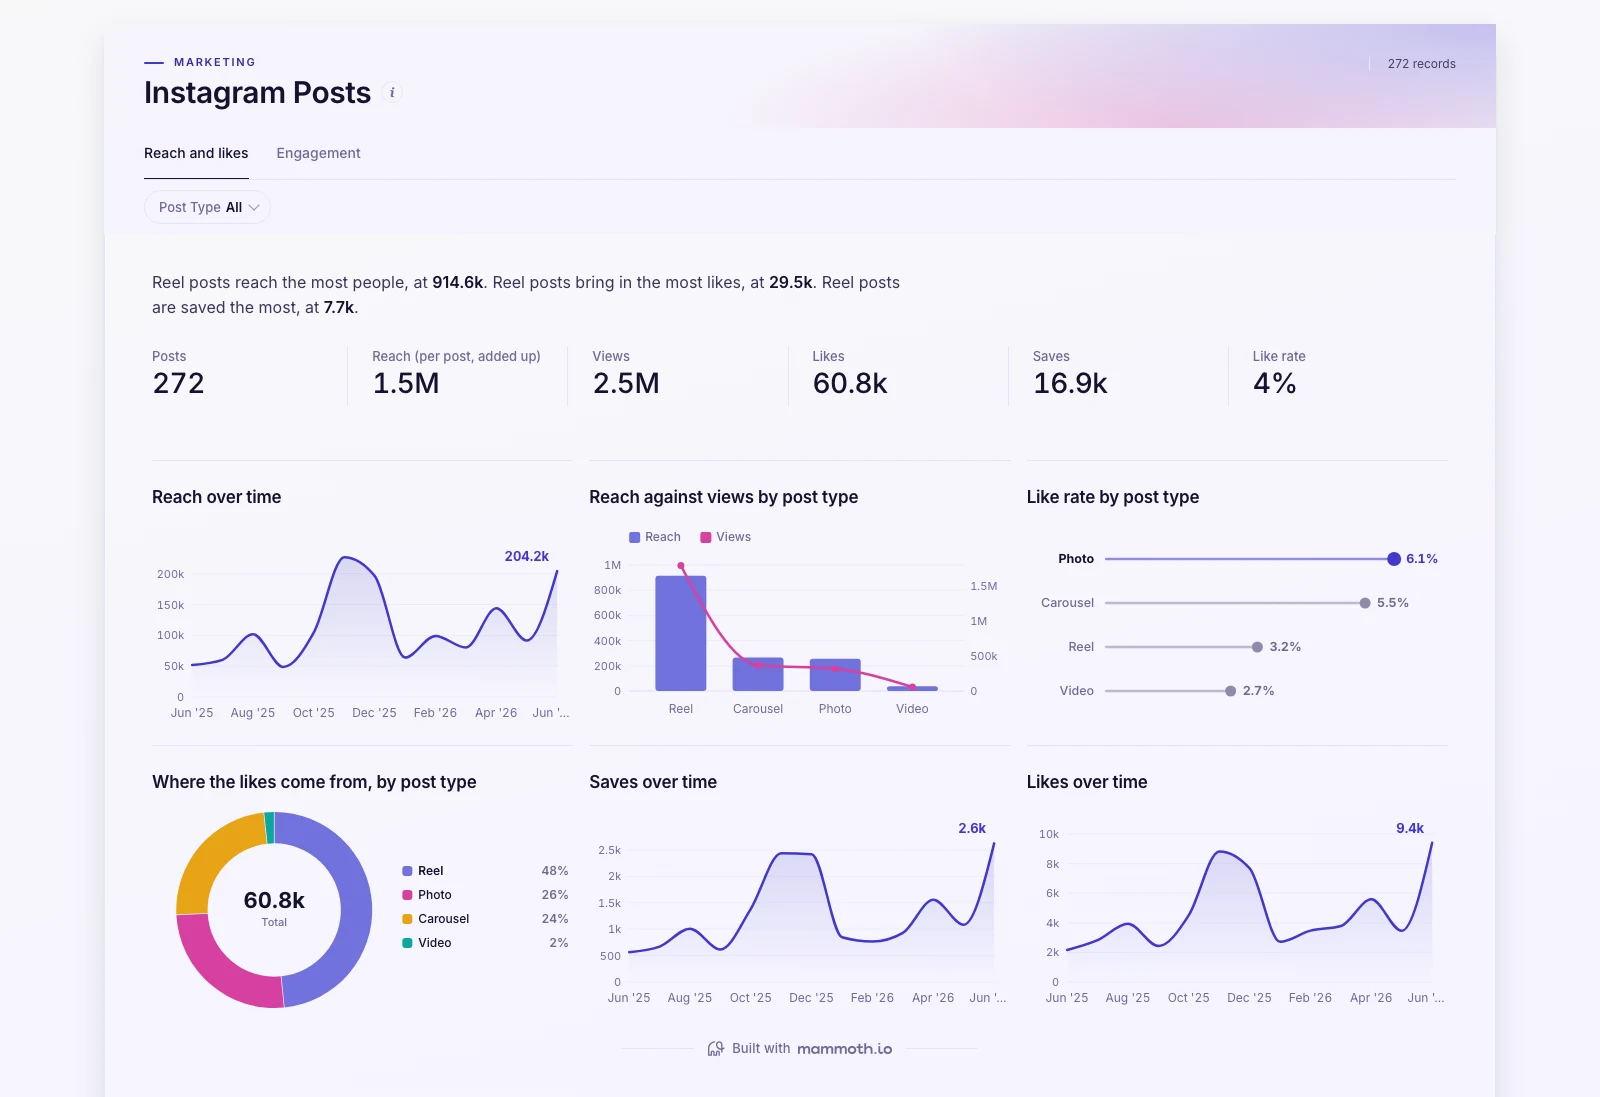
Every Instagram post: how far it reached, how many watched, liked and saved it, and which kinds of post earn their keep, by month and post type. Connect Instagram and it fills in from your account.
DashboardMarketingInstagramHR Analytics
Engagement, performance and absence read together, so the outliers stand out.
DashboardPeopleAny industryYouTube Channel Analytics
Your channel's views, watch time, subscribers gained and lost, day by day, for videos, Shorts and live streams. Connect YouTube and it fills in from your channel.
DashboardMarketingYouTubeHeadcount & Attrition
Who is here, who left, and how long people stay — by department and level.
DashboardPeopleAny industryLinkedIn Page Analytics
Your LinkedIn company Page, day by day: how often it was seen, clicked and reacted to, and how many followers it gained. LinkedIn keeps the last 12 months. Connect LinkedIn and it fills in from your account.
DashboardMarketingLinkedInSales KPI Scorecard
Deal size, confidence and cycle length, cut by rep, stage and source.
DashboardSalesAny industryFinancial Performance
Revenue, margin and operating income by business unit and region, month by month.
DashboardFinanceAny industryCompensation Review
What each level and location costs, and where pay sits against tenure.
DashboardPeopleAny industrySales Pipeline
What is still open, which stage it sits in, and what it is worth weighted.
DashboardSalesAny industryFinancial KPI Scorecard
The handful of numbers a finance review opens with, and their trend.
DashboardFinanceAny industryLinkedIn Ads Performance
Your LinkedIn Ads campaigns: what you spent, the leads it brought in and what each lead cost, month by month. Connect LinkedIn Ads and it fills in from your account.
DashboardMarketingLinkedIn AdsSearch Console Report
Your Google search results: the clicks and impressions your site earns, how often people click, and how much of it comes from searches that do not name you. Brand is any query containing your site's name; queries too rare for Search Console to report are left out. Connect Search Console and it fills in from your account.
DashboardSEOSearch ConsolePipedrive Deals
Your Pipedrive deals: what was won, what is still open, how often you win and which stages and owners carry the pipeline. Connect Pipedrive and it fills in from your account.
DashboardSalesPipedriveStore-Level Margin
Which stores make money, and what is moving their margin.
DashboardOperationsRetailInventory Management
Stock on hand, what it is worth and how fast it moves, by category and site.
DashboardInventoryAny industrySales Tracker
Your team's sales sheet: revenue, deals and deal size by rep, region and product, month by month. Upload a Google Sheets export and it fills in.
DashboardSalesGoogle SheetsBudget vs Actual
Where the plan held and where it did not, by unit, region and quarter.
DashboardFinanceAny industryProject Status
What is done, in flight, blocked or late — across every workstream.
DashboardProjectAny industryMarketing Performance
Spend, conversions and return across every channel, week by week.
DashboardMarketingAny industryInventory Valuation
What the stock is worth, which lines hold it, and where it is sitting.
DashboardInventoryAny industryCampaign Performance
Every campaign side by side on cost, conversion and return.
DashboardMarketingAny industryStore Comparison & Like-for-Like
Which stores are genuinely improving, once new space is stripped out.
DashboardOperationsRetailChannel ROI
What each channel costs to run and what it returns, with the efficiency spread.
DashboardMarketingAny industryStock Health & Reorder
What is below its reorder point, what has run dry, and what is sitting too long.
DashboardInventoryAny industryWarehouse Performance
Intake against despatch by site, with turns, cover and what each site is short of.
DashboardInventoryAny industryProject Portfolio
Every programme on one page: hours, budget and where cost is running over.
DashboardProjectAny industryPromotion & Discount Effectiveness
Did the promotion make money, or just move it?
DashboardMarketingRetailCollections & AR Aging
What is owed, how old it is, and which accounts are carrying it.
DashboardFinanceAny industryCash Collection Forecast
When the open ledger is expected to turn into cash, and what could hold it up.
DashboardFinanceAny industrySlow & Aged Stock
What has stopped moving, what it is worth, and which sites are carrying it.
DashboardInventoryAny industrySell-Through by Category
Is the season selling through at the rate the buy was planned on?
DashboardInventoryRetailHeadcount Report
The people picture written up: who joined, who left and what it costs.
DocumentPeopleAny industryPortfolio KPI Rollup
Every portfolio company's monthly numbers in one view: growth, burn and runway.
DashboardExecutiveAny industryInventory & Stockouts
What is about to run out, and what has not moved all season.
DashboardInventoryRetailGA4 Website Traffic
Your website's sessions, engagement, key events and revenue, by channel and device. Connect Google Analytics and it fills in from your property.
DashboardMarketingGA4Fulfilment & Returns
Are orders arriving on time, and how much is coming back?
DashboardOperationsRetailHubSpot Deals
Your HubSpot deals: what was won, what is still open, which sources bring revenue and how long deals take. Connect HubSpot and it fills in from your portal.
DashboardSalesHubSpotSEO Performance
Clicks, impressions and average position, and which queries are climbing.
DashboardSEOAny industryMailchimp Campaigns
Every Mailchimp campaign you sent: who opened, who clicked, who left, and the orders and revenue it brought in. Rates are over emails sent; Apple Mail Privacy Protection opens mail on its own, so opens read high and clicks are the surer signal. Connect Mailchimp and it fills in from your account.
DashboardMarketingMailchimpSpend & Vendor Concentration
Where the money goes, how few vendors it goes to, and what sits outside contract.
DashboardFinanceAny industryMonthly Investor Update
The month for investors: highlights, customers and cash out the door.
DocumentExecutiveSaaSContent Performance
Which pages earn their keep, which are seen and not clicked, and where links sit.
DashboardSEOAny industryMeta Ads Performance
Your Facebook and Instagram ads: what you spent, who saw it, what it cost and what it sold. Connect Meta Ads and it fills in from your ad account.
DashboardMarketingMeta AdsMarketing Performance Report
The period's marketing written up: spend, return and what each channel did.
DocumentMarketingAny industrySalesforce Pipeline
Your Salesforce opportunities: what was won, what is still open, and where deals stall. Connect Salesforce and it fills in from your org.
DashboardSalesSalesforceSEO Reporting
The monthly read: traffic, rankings and conversions, by market and intent.
DashboardSEOAny industryShopify Sales
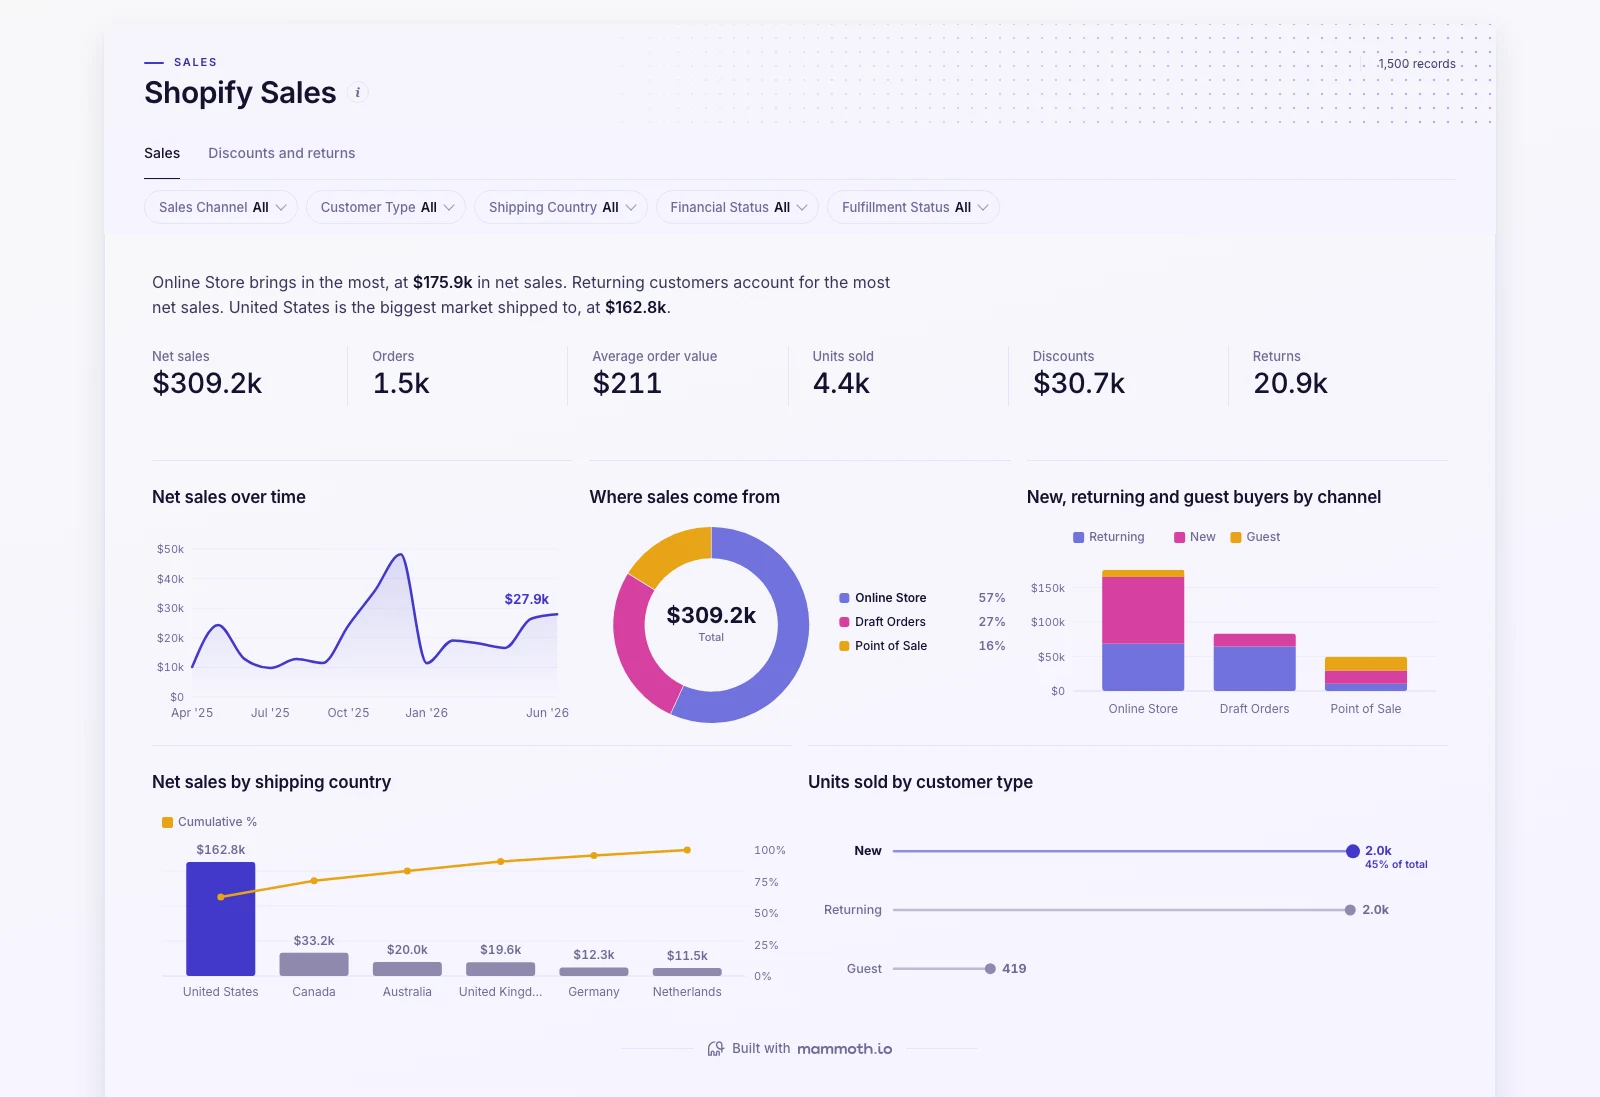
Your Shopify orders: net sales, order value, and what discounts and returns take off the top. Connect Shopify and it fills in from your store.
DashboardSalesShopifyBoard Pack
The quarter for a board audience: revenue, margin, plan and what is next.
PresentationFinanceAny industrySaaS Metrics
MRR growth, retention and unit economics by plan tier and region.
DashboardExecutiveSaaSHR Scorecard
The people numbers a leadership review opens with, on one screen.
DashboardPeopleAny industryMonthly Financial Report
The month written up: revenue, margin, variance to plan and what moved.
DocumentFinanceAny industryCampaign Recap Deck
A campaign told as a story: what it cost, what it returned, what to keep.
PresentationMarketingAny industryExecutive Summary
The quarter in one read: what the numbers did, where, and against plan.
DocumentFinanceAny industryStartup Board Deck
The venture board meeting: growth, retention, efficiency and burn.
PresentationExecutiveSaaSStartup Board Report
The period for a board: growth, retention, efficiency and burn.
DocumentExecutiveSaaSSales Review Report
The book written up: what closed, what is open and how long it is taking.
DocumentSalesAny industryProgramme Review Deck
Every programme for a steering audience: progress, effort, cost and risk.
PresentationProjectAny industryQuarterly Business Review
The quarter's sales story: what closed, who closed it, and what is next.
PresentationSalesAny industry