← All templates
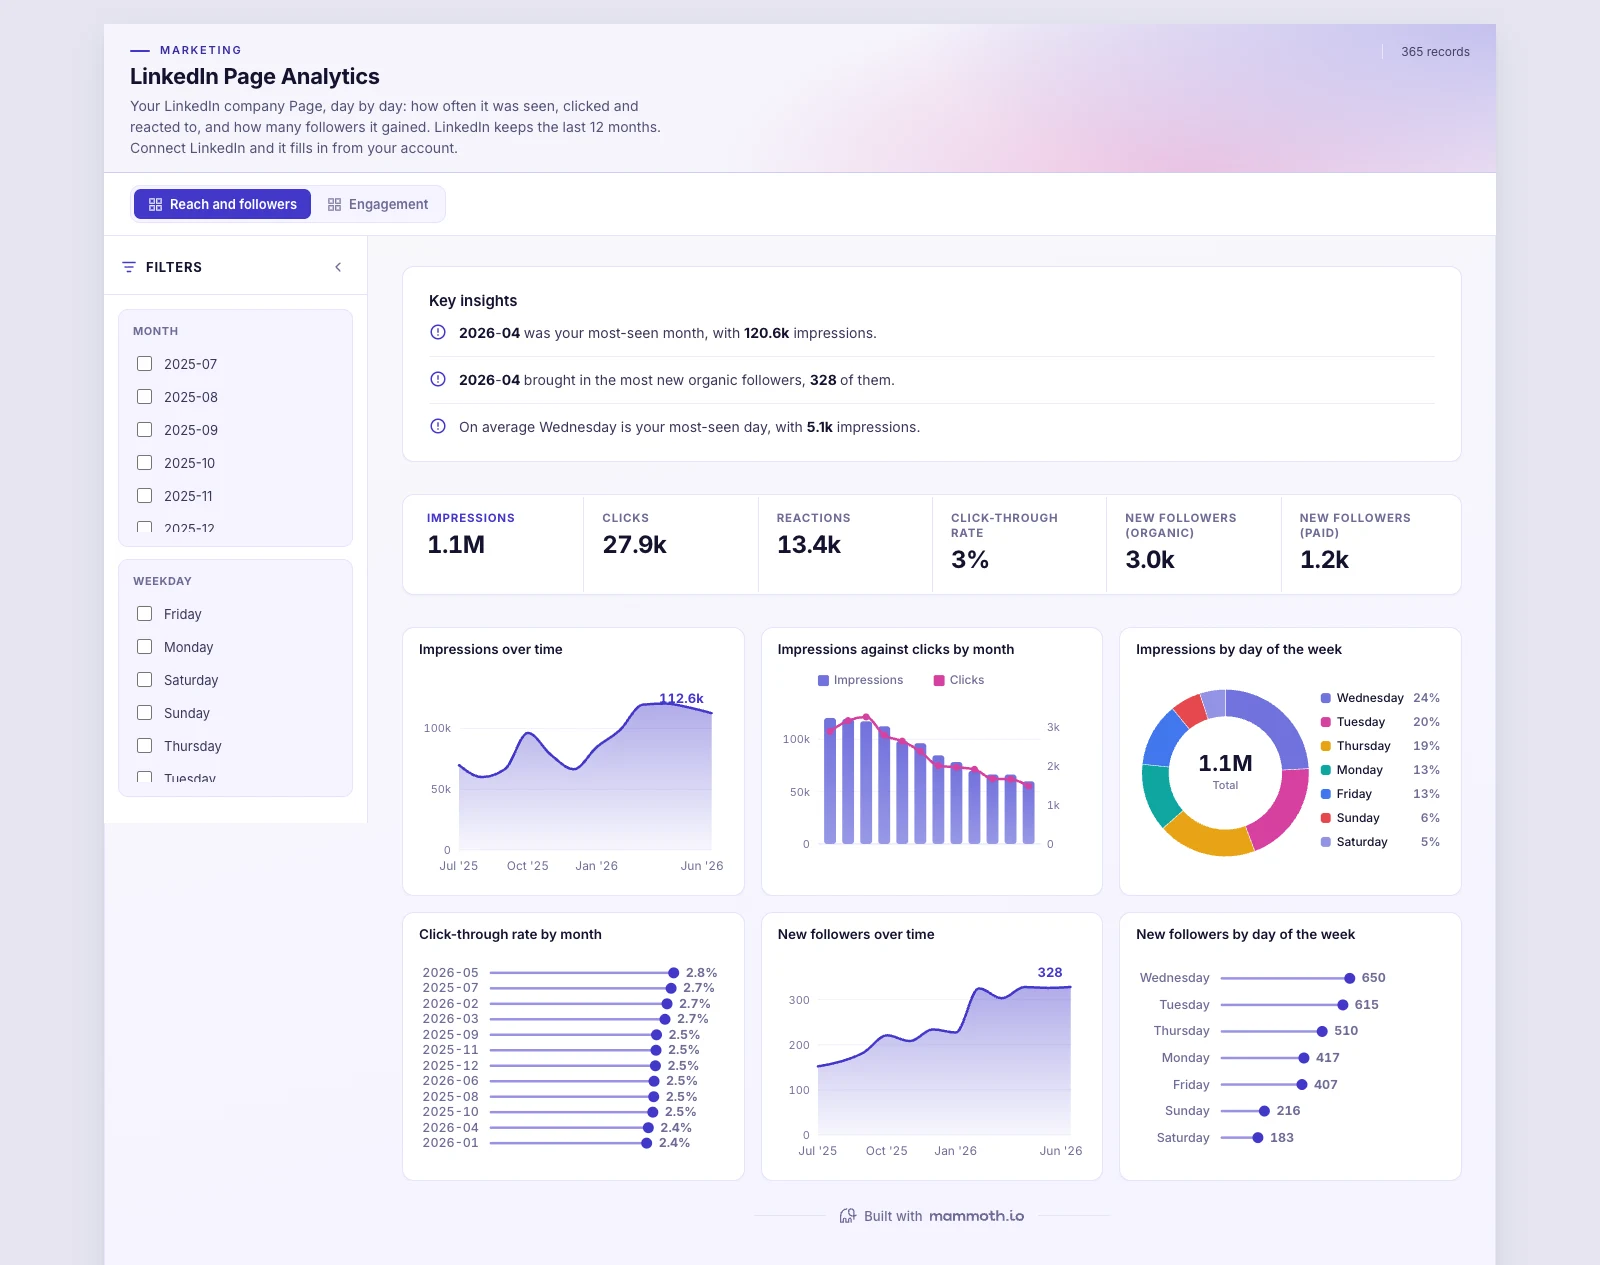
Shown on sample data. The figures are illustrative, not real business results — take the template and point it at your own.
LinkedIn Page Analytics
Your LinkedIn company Page, day by day: how often it was seen, clicked and reacted to, and how many followers it gained. LinkedIn keeps the last 12 months. Connect LinkedIn and it fills in from your account.
DashboardMarketingLinkedInWhat it needs from your data
| Needs | a numeric amount, a category (~12 values) |
|---|---|
| Optional | dates for trends, 8 more |
What is on it
Reach and followers shown above
- Impressions over time Area chart
- Impressions against clicks by month Combo chart
- Impressions by day of the week Donut chart
- Click-through rate by month Ranking chart
- New followers over time Area chart
- New followers by day of the week Ranking chart
Engagement shown above
- Reactions over time Area chart
- How daily impressions spread by day of the week Box plot
- Impressions by day of the week and month Heatmap
- Clicks by day of the week Ranking chart
- Clicks against impressions, day by day Scatter plot
- How many impressions a day brings Histogram