← All templates
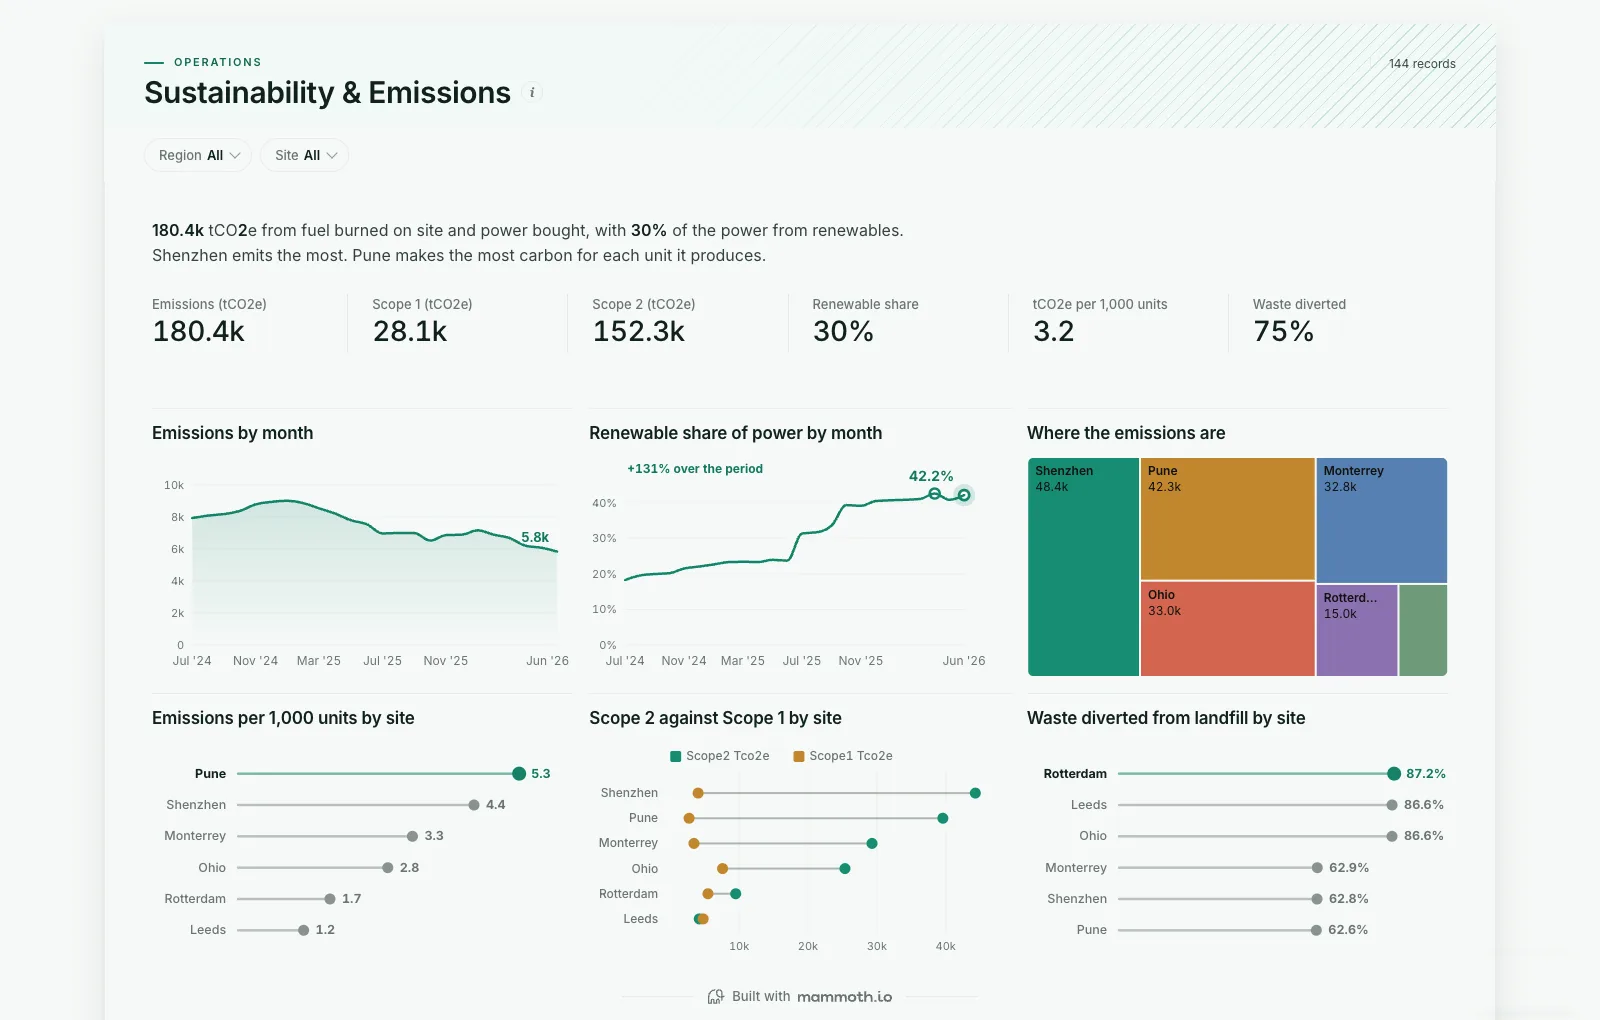
Shown on sample data. The figures are illustrative, not real business results — take the template and point it at your own.
Sustainability & Emissions
Are emissions falling, which sites carry them, and how much of the power is renewable?
DashboardOperationsAny industryWhat it needs from your data
| Needs | a numeric amount, a category (~6 values) |
|---|---|
| Optional | dates for trends, 8 more |
What is on it
- Emissions by month Area chart
- Renewable share of power by month Line chart
- Where the emissions are Treemap
- Emissions per 1,000 units by site Ranking chart
- Scope 2 against Scope 1 by site Dumbbell chart
- Waste diverted from landfill by site Ranking chart