← All templates
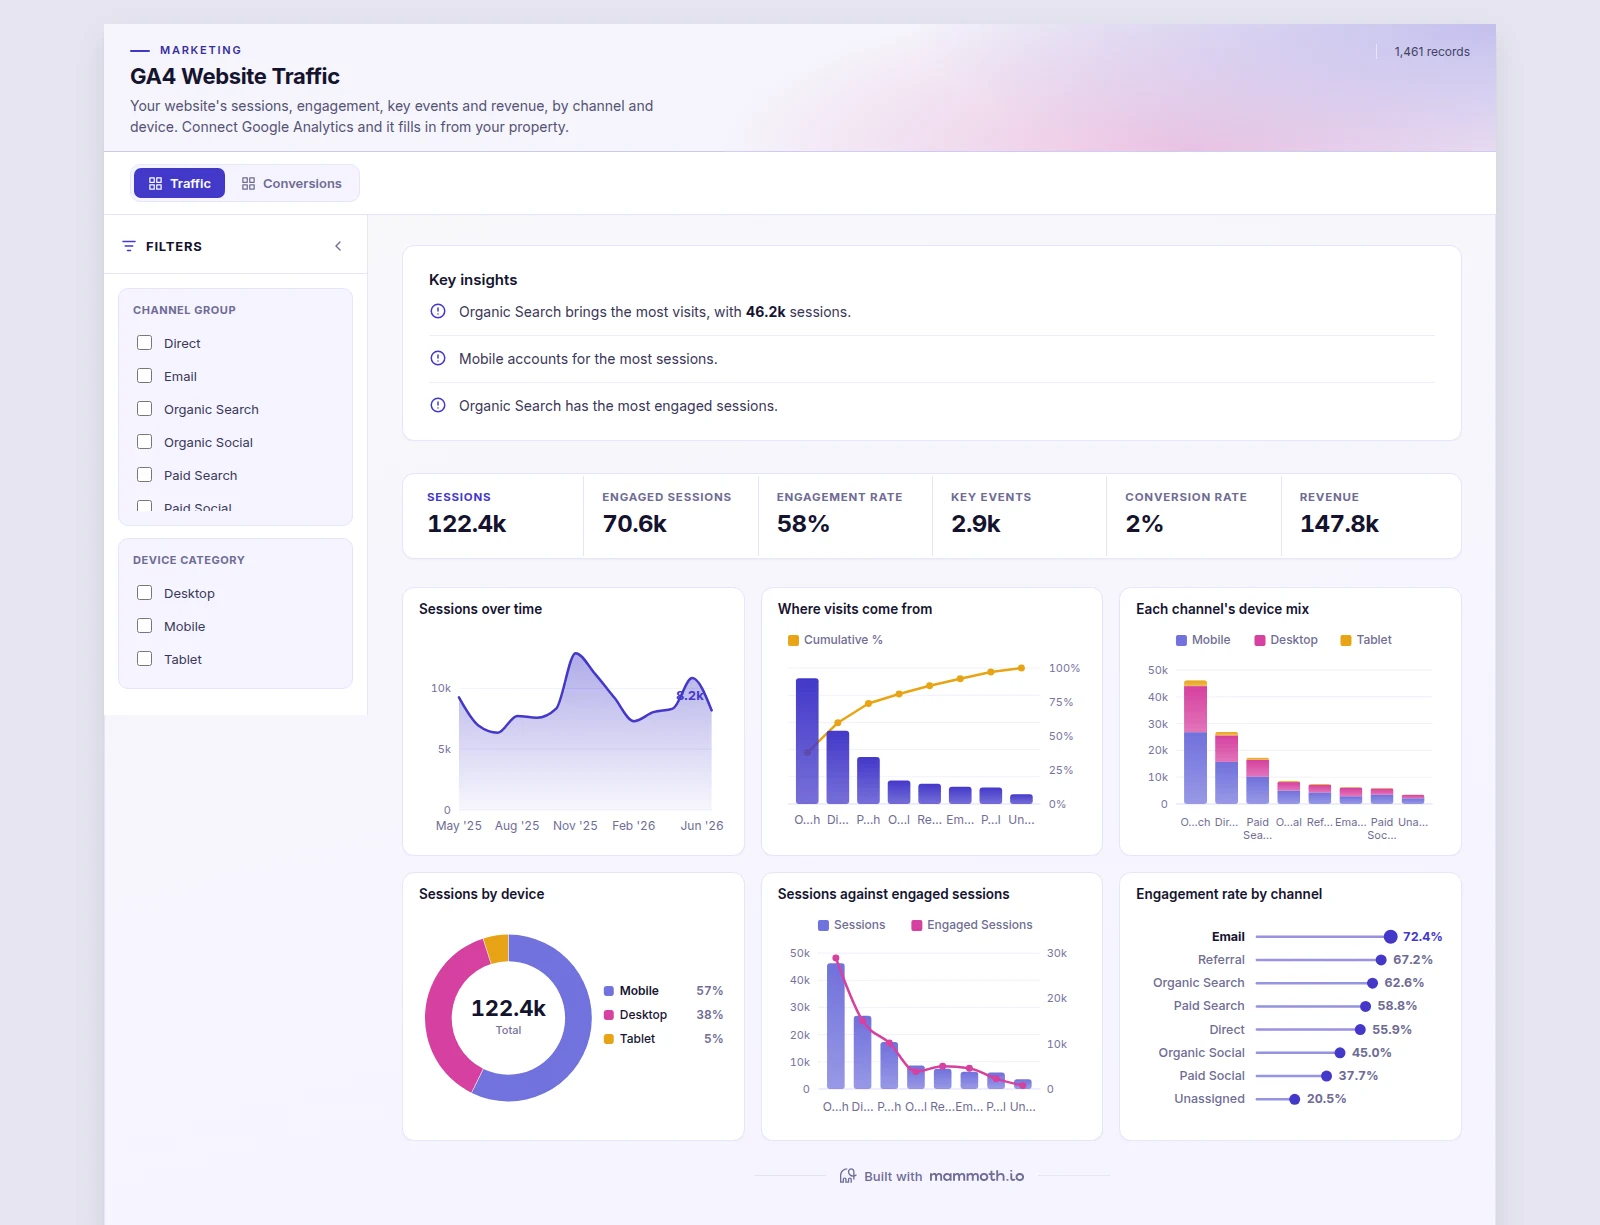
Shown on sample data. The figures are illustrative, not real business results — take the template and point it at your own.
GA4 Website Traffic
Your website's sessions, engagement, key events and revenue, by channel and device. Connect Google Analytics and it fills in from your property.
DashboardMarketingGA4What it needs from your data
| Needs | a count column, a category (~8 values) |
|---|---|
| Optional | dates for trends, 7 more |
What is on it
Traffic shown above
- Sessions over time Area chart
- Where visits come from Pareto chart
- Each channel's device mix Stacked bar chart
- Sessions by device Donut chart
- Sessions against engaged sessions Combo chart
- Engagement rate by channel Ranking chart
Conversions shown above
- Revenue by channel Pareto chart
- Revenue over time Area chart
- Conversion rate by channel Ranking chart
- Key events by channel and device Grouped bar chart
- Engagement against conversion Scatter plot
- Revenue by channel and device Heatmap