← All templates
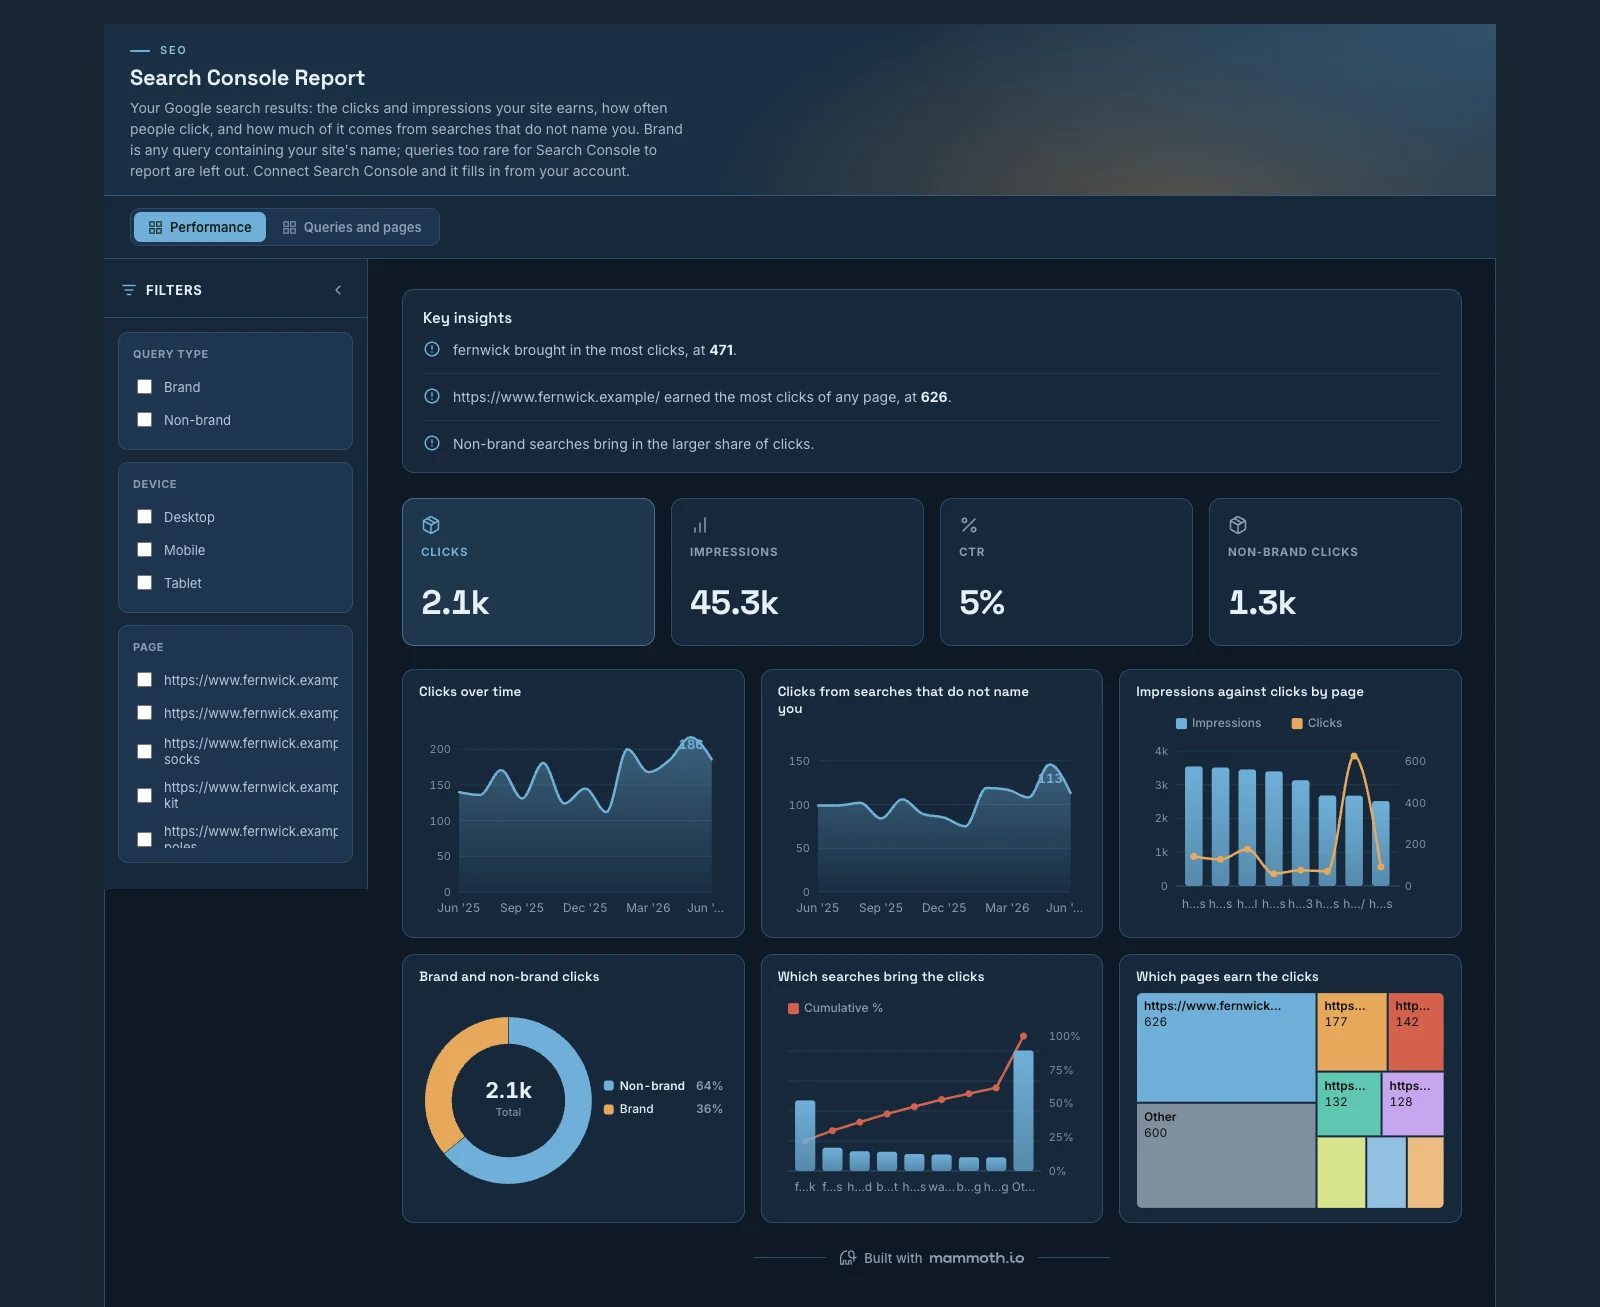
Shown on sample data. The figures are illustrative, not real business results — take the template and point it at your own.
Search Console Report
Your Google search results: the clicks and impressions your site earns, how often people click, and how much of it comes from searches that do not name you. Brand is any query containing your site's name; queries too rare for Search Console to report are left out. Connect Search Console and it fills in from your account.
DashboardSEOSearch ConsoleWhat it needs from your data
| Needs | a count column, a category column |
|---|---|
| Optional | dates for trends, 8 more |
What is on it
Performance shown above
- Clicks over time Area chart
- Clicks from searches that do not name you Area chart
- Impressions against clicks by page Combo chart
- Brand and non-brand clicks Donut chart
- Which searches bring the clicks Pareto chart
- Which pages earn the clicks Treemap
Queries and pages shown above
- Average position over time Area chart
- Where each page ranks Ranking chart
- How often each search is clicked Ranking chart
- Daily click-through by device Box plot
- Click-through against position, day by day Scatter plot
- Impressions by device Donut chart