← All templates
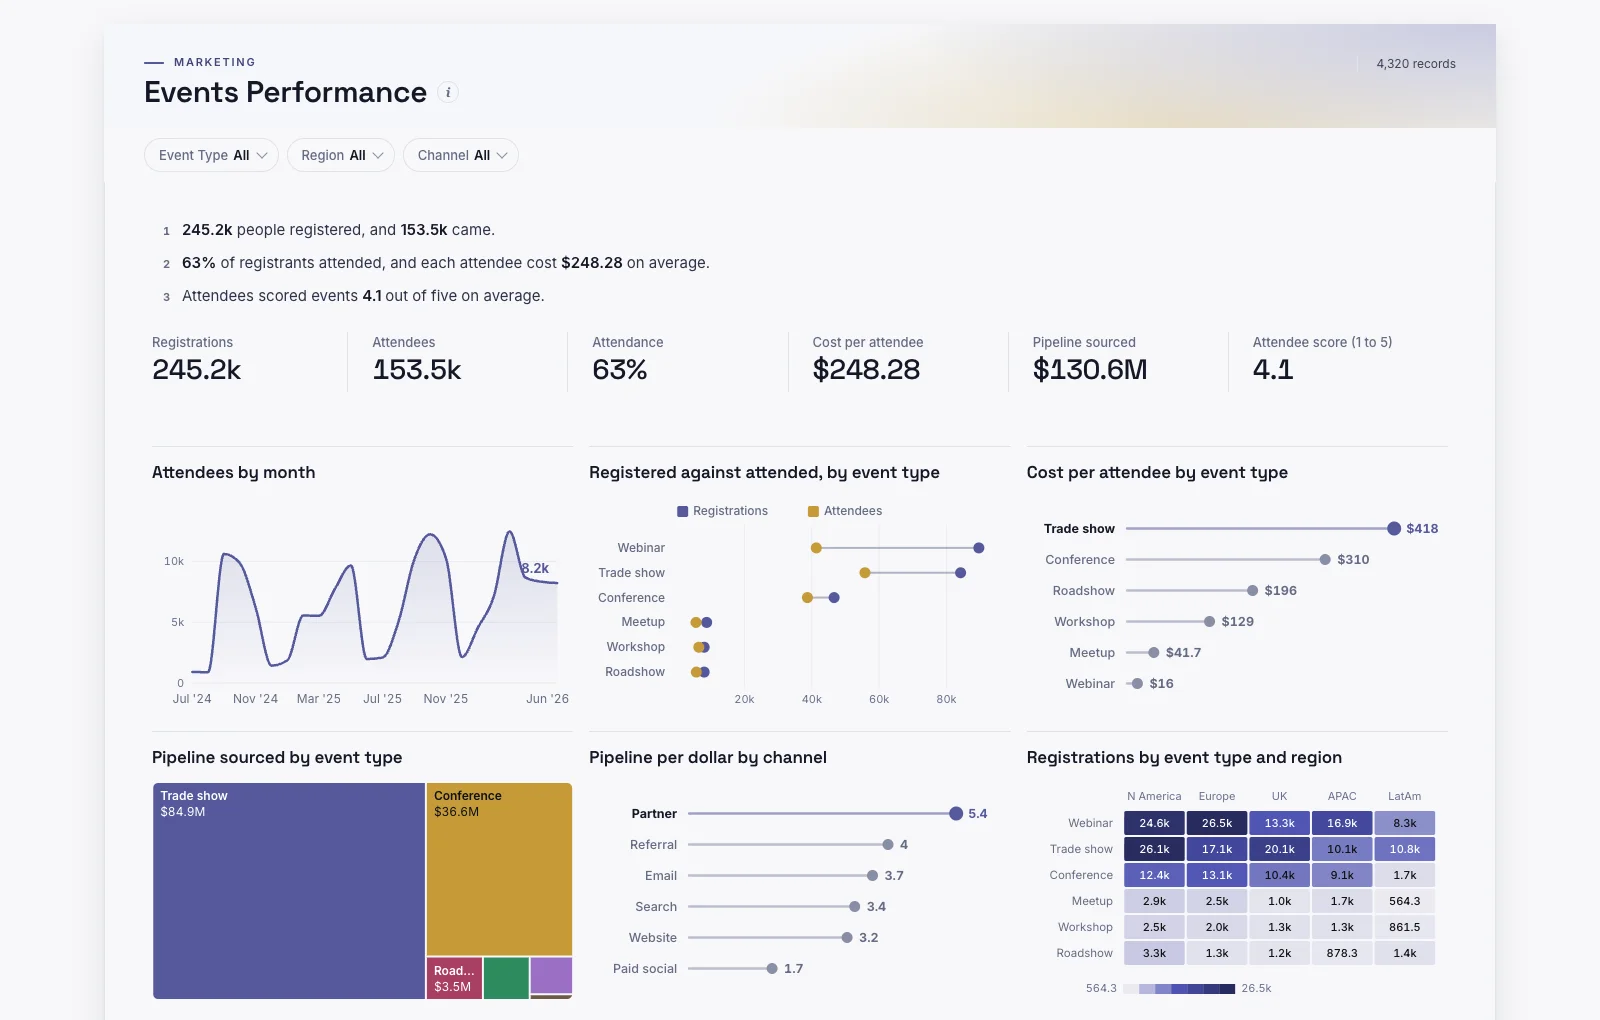
Shown on sample data. The figures are illustrative, not real business results — take the template and point it at your own.
Events Performance
How many people registered and showed up, what each attendee cost, and which events and channels earn their budget?
DashboardMarketingAny industryWhat it needs from your data
| Needs | a count column, a category (~6 values) |
|---|---|
| Optional | dates for trends, 7 more |
What is on it
- Attendees by month Area chart
- Registered against attended, by event type Dumbbell chart
- Cost per attendee by event type Ranking chart
- Pipeline sourced by event type Treemap
- Pipeline per dollar by channel Ranking chart
- Registrations by event type and region Heatmap