← All templates
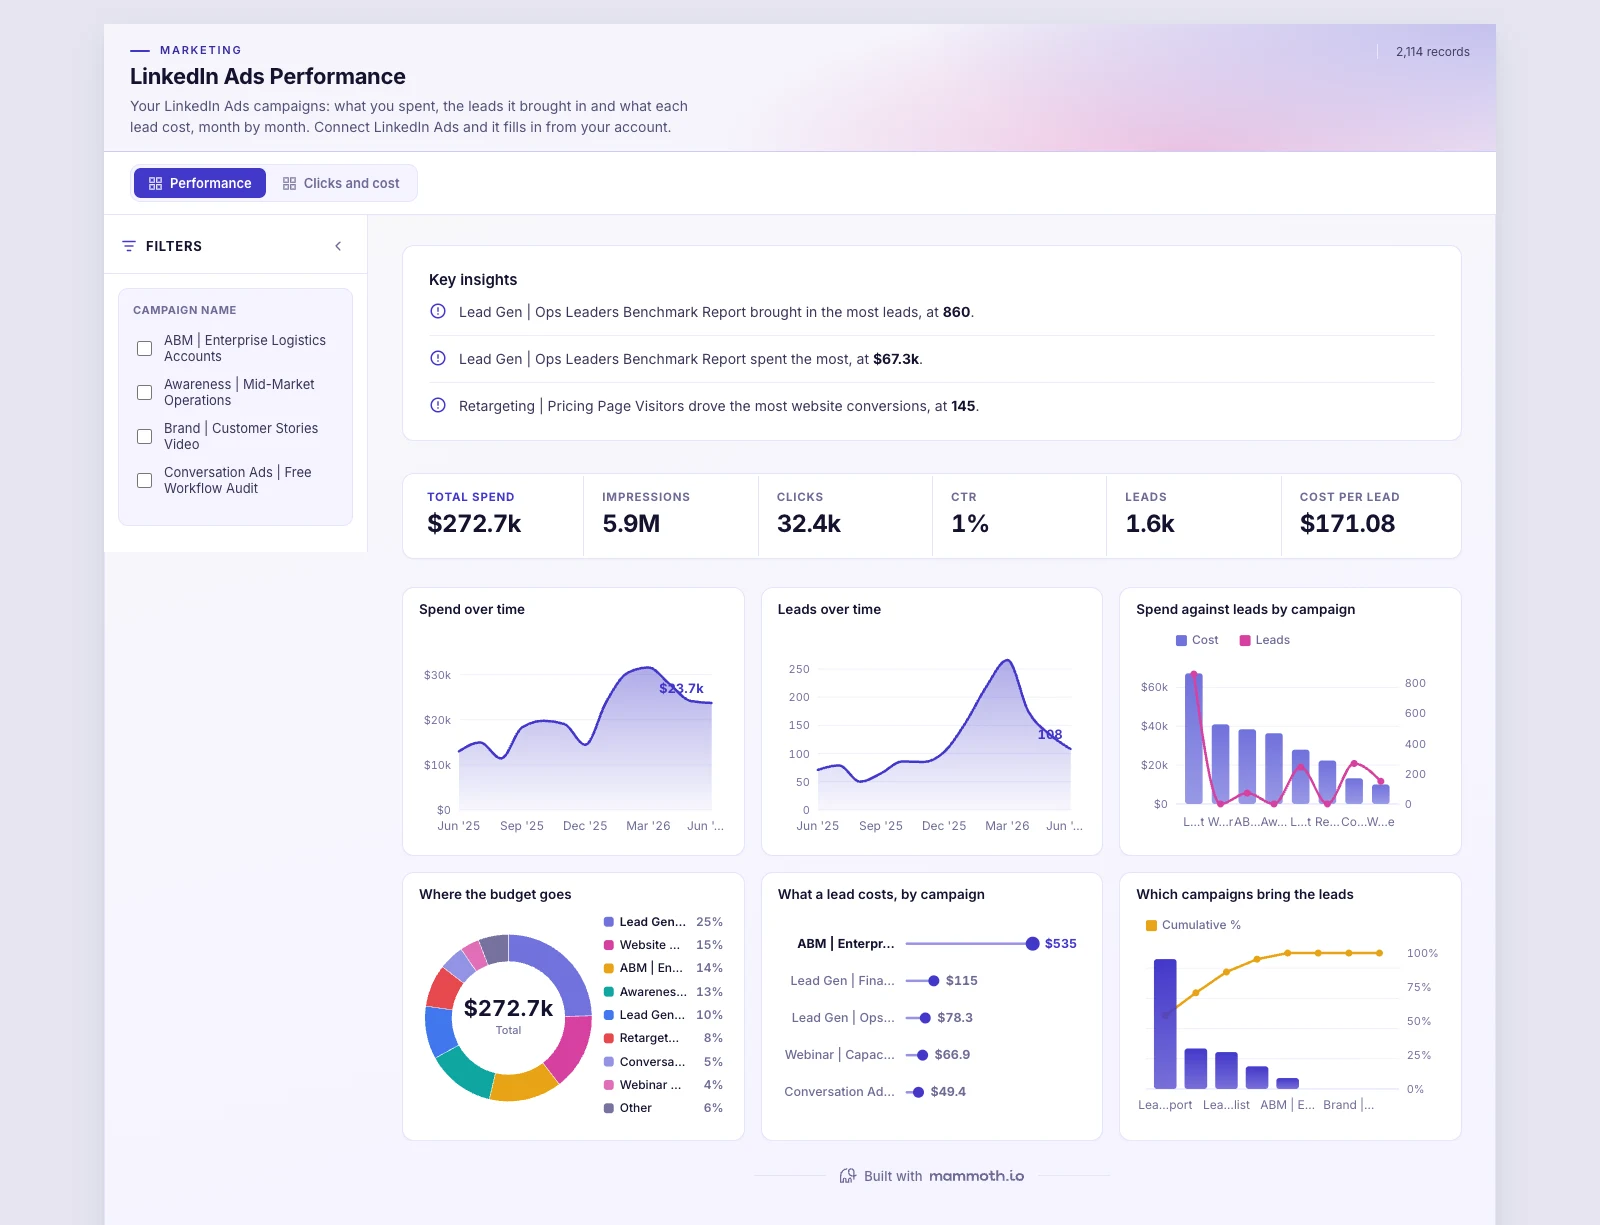
Shown on sample data. The figures are illustrative, not real business results — take the template and point it at your own.
LinkedIn Ads Performance
Your LinkedIn Ads campaigns: what you spent, the leads it brought in and what each lead cost, month by month. Connect LinkedIn Ads and it fills in from your account.
DashboardMarketingLinkedIn AdsWhat it needs from your data
| Needs | a count column, a category (~10 values) |
|---|---|
| Optional | dates for trends, 6 more |
What is on it
Performance shown above
- Spend over time Area chart
- Leads over time Area chart
- Spend against leads by campaign Combo chart
- Where the budget goes Donut chart
- What a lead costs, by campaign Ranking chart
- Which campaigns bring the leads Pareto chart
Clicks and cost shown above
- Clicks over time Area chart
- What a click costs, by campaign Ranking chart
- Daily cost per click by campaign Box plot
- Cost per click against click-through, day by day Scatter plot
- Where the clicks come from Treemap