← All templates
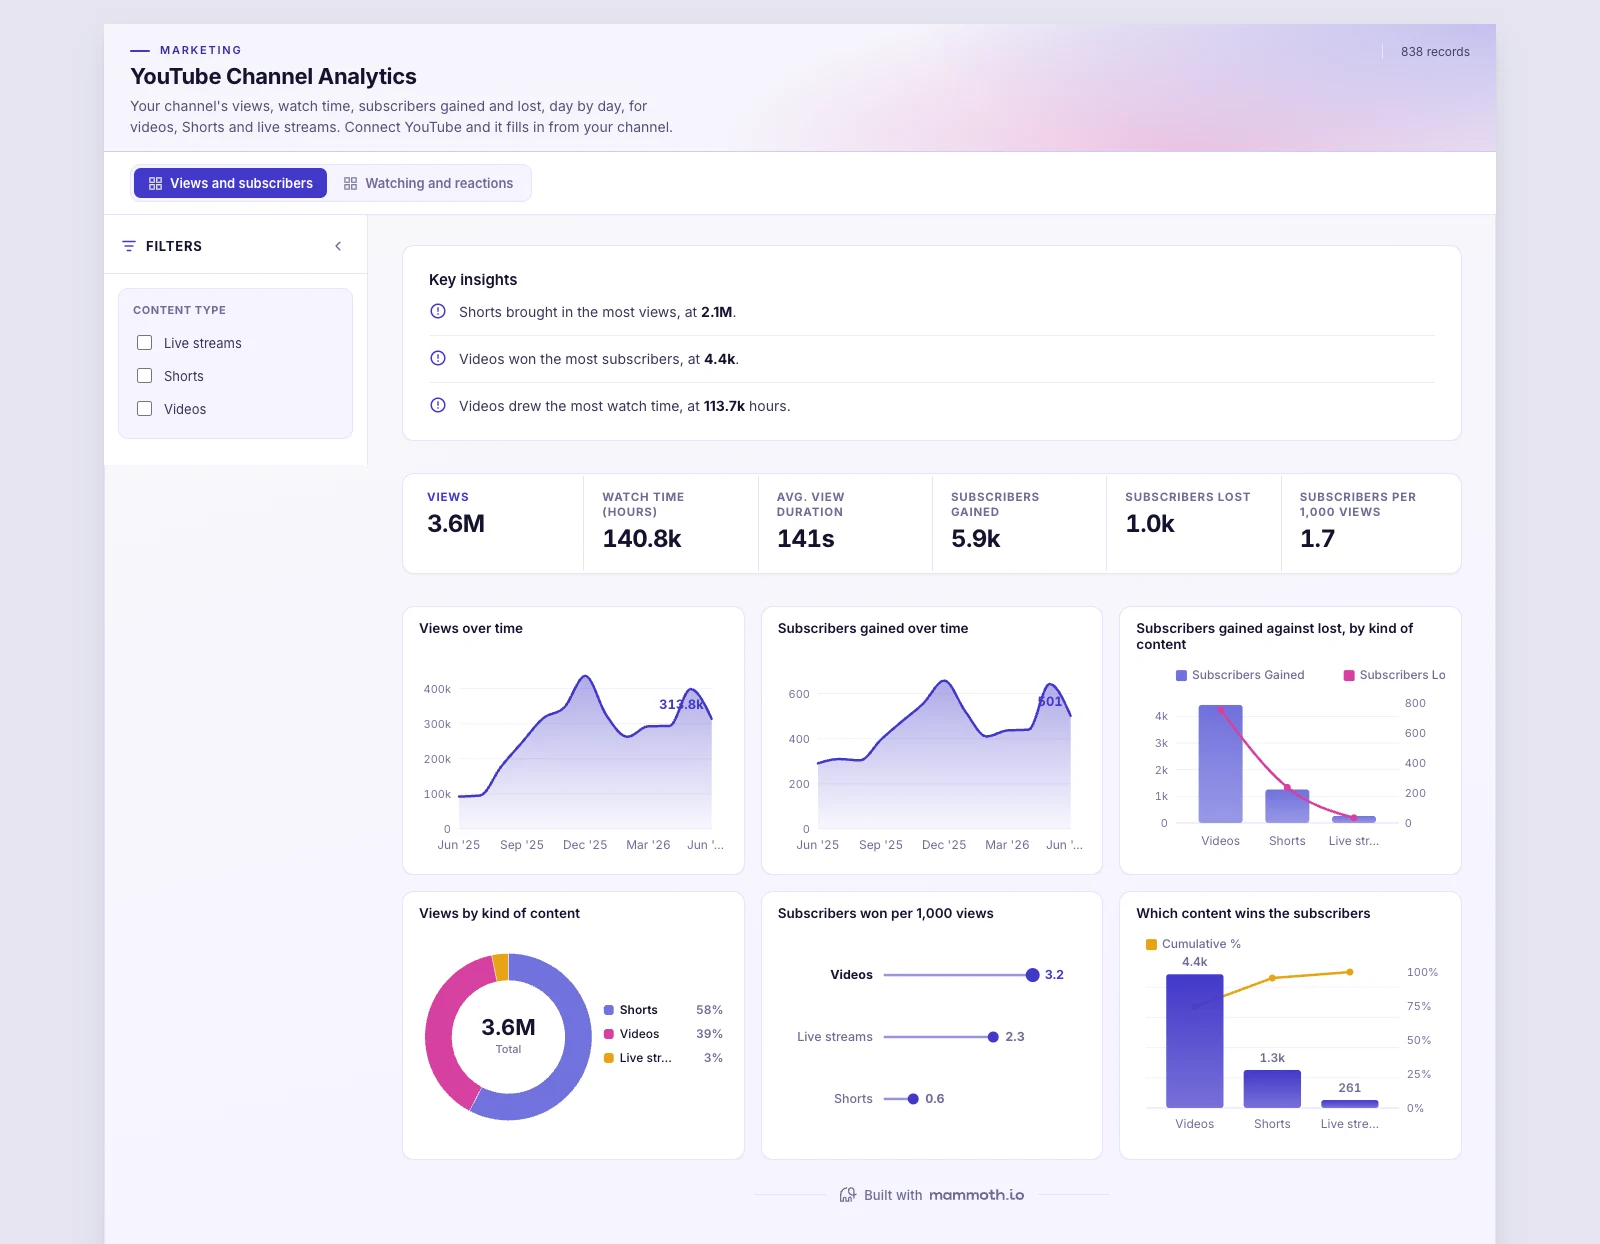
Shown on sample data. The figures are illustrative, not real business results — take the template and point it at your own.
YouTube Channel Analytics
Your channel's views, watch time, subscribers gained and lost, day by day, for videos, Shorts and live streams. Connect YouTube and it fills in from your channel.
DashboardMarketingYouTubeWhat it needs from your data
| Needs | a count column, a category (~3 values) |
|---|---|
| Optional | dates for trends, 7 more |
What is on it
Views and subscribers shown above
- Views over time Area chart
- Subscribers gained over time Area chart
- Subscribers gained against lost, by kind of content Combo chart
- Views by kind of content Donut chart
- Subscribers won per 1,000 views Ranking chart
- Which content wins the subscribers Pareto chart
Watching and reactions shown above
- Watch time over time Area chart
- How long people watch, by kind of content Ranking chart
- Daily likes per 1,000 views by kind of content Box plot
- Views against watch time, day by day Scatter plot
- Where the watch time comes from Treemap