← All templates
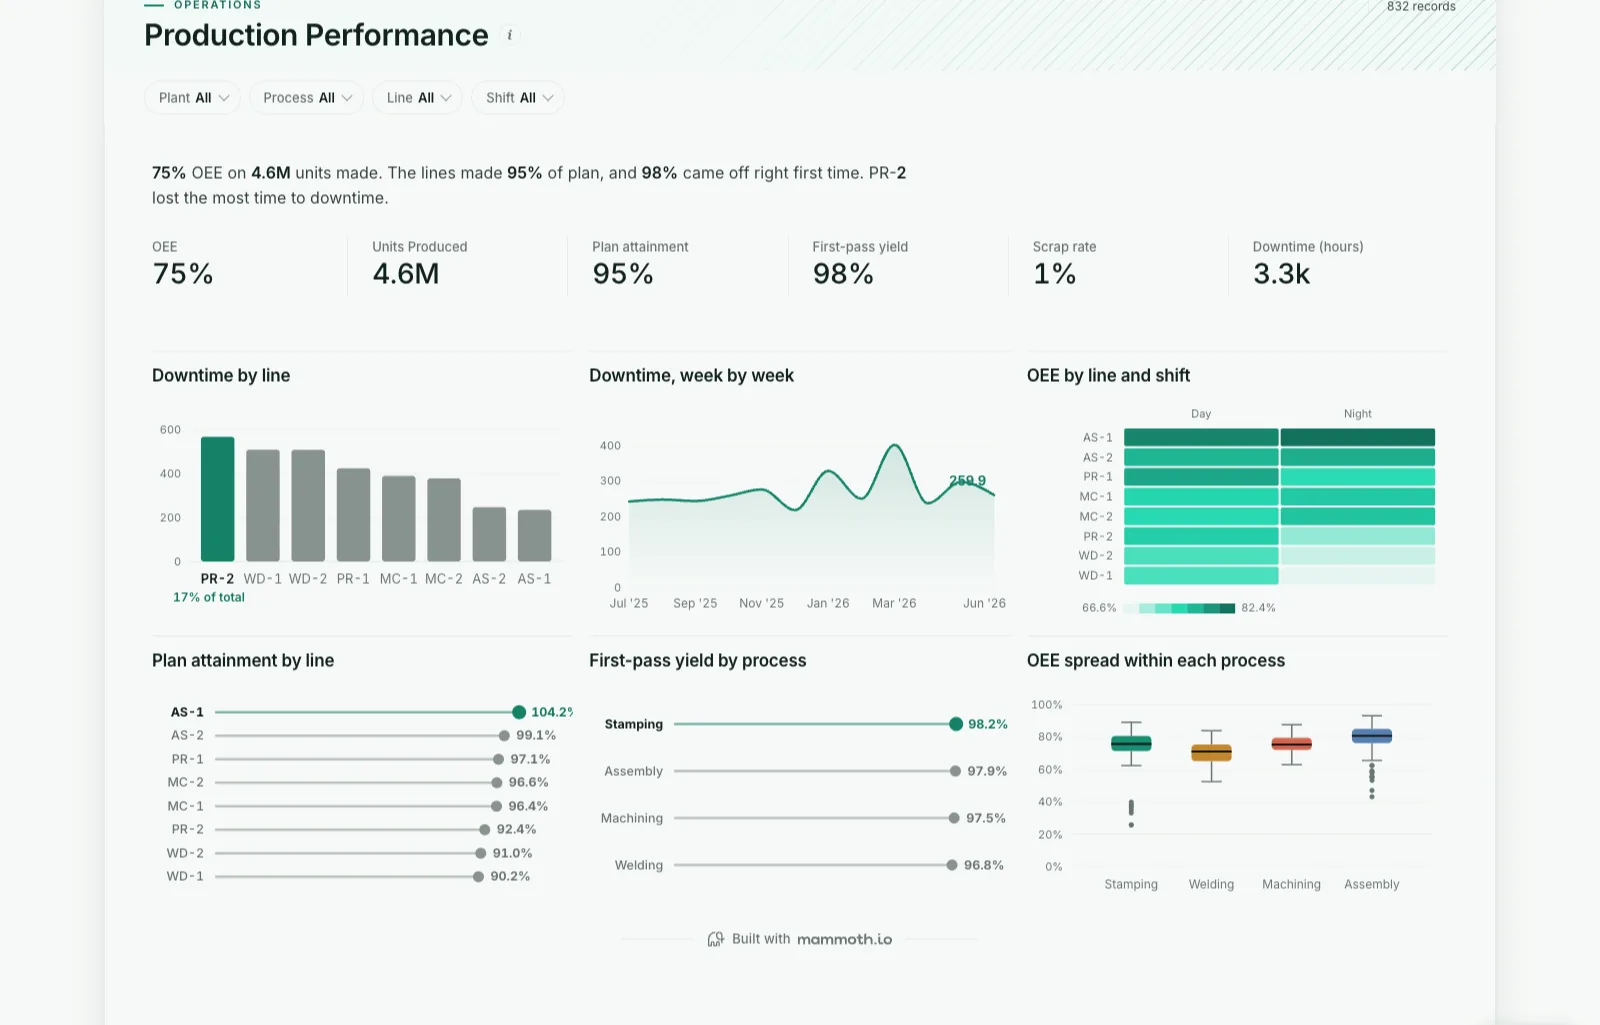
Shown on sample data. The figures are illustrative, not real business results — take the template and point it at your own.
Production Performance
Is each line making its plan, how much of it is good, and where is the time going?
DashboardOperationsManufacturingWhat it needs from your data
| Needs | a count column, a category (~8 values) |
|---|---|
| Optional | dates for trends, 10 more |
What is on it
- Downtime by line Bar chart
- Downtime, week by week Area chart
- OEE by line and shift Heatmap
- Plan attainment by line Ranking chart
- First-pass yield by process Ranking chart
- OEE spread within each process Box plot