← All templates
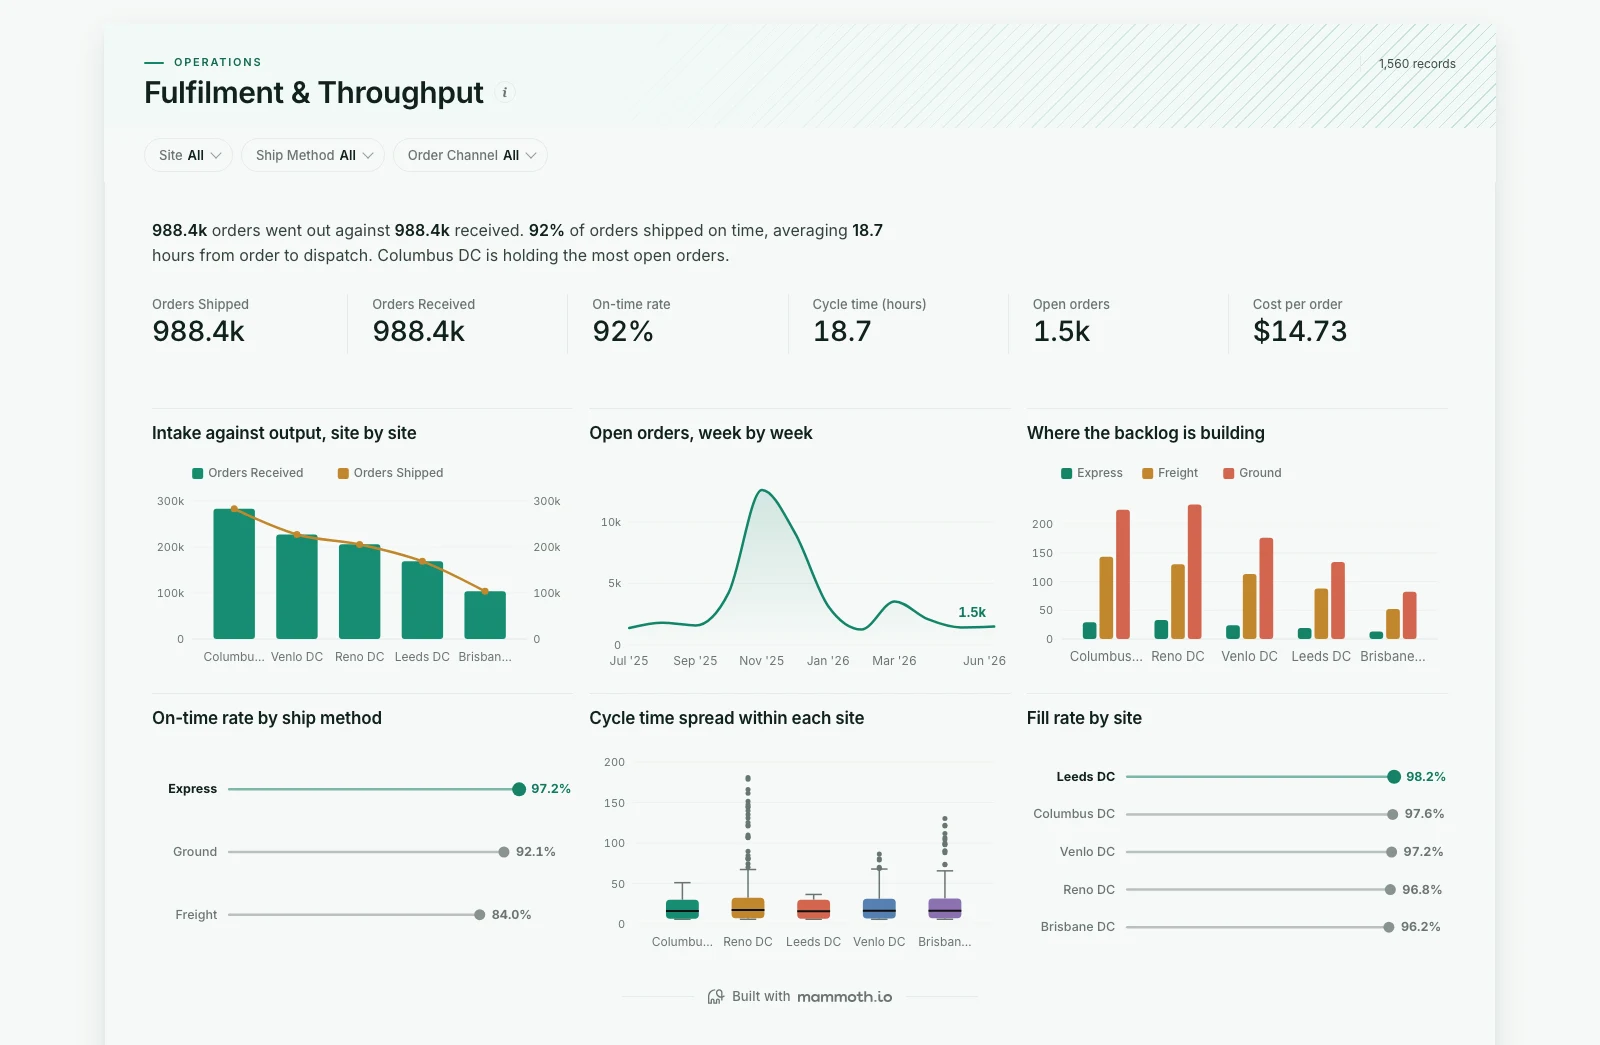
Shown on sample data. The figures are illustrative, not real business results — take the template and point it at your own.
Fulfilment & Throughput
Are orders going out on time, is each site keeping up with intake, and where is the backlog building?
DashboardOperationsAny industryWhat it needs from your data
| Needs | a count column, a category (~5 values) |
|---|---|
| Optional | dates for trends, 10 more |
What is on it
- Intake against output, site by site Combo chart
- Open orders, week by week Area chart
- Where the backlog is building Grouped bar chart
- On-time rate by ship method Ranking chart
- Cycle time spread within each site Box plot
- Fill rate by site Ranking chart