← All templates
Shown on sample data. The figures are illustrative, not real business results — take the template and point it at your own.
Customer Support
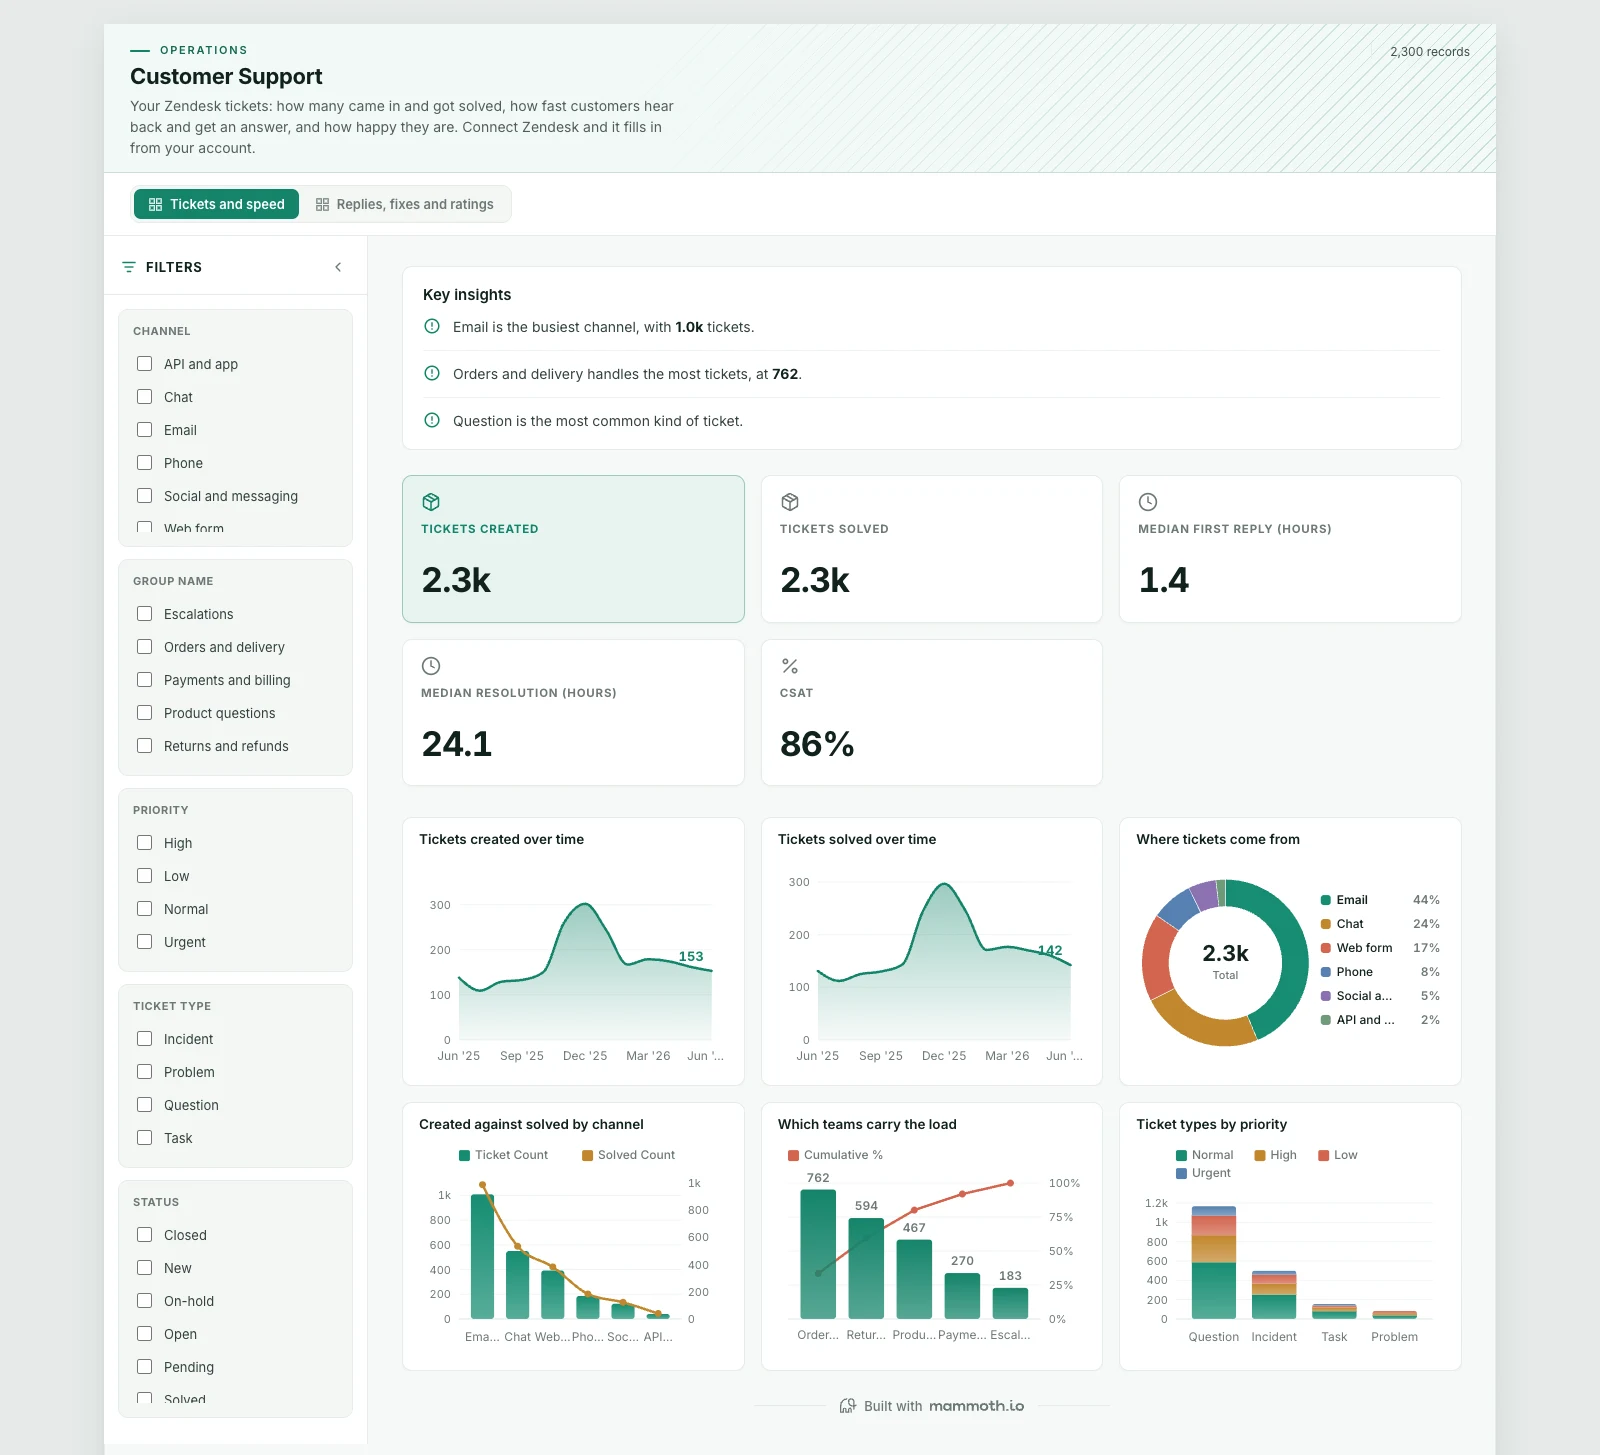
Your Zendesk tickets: how many came in and got solved, how fast customers hear back and get an answer, and how happy they are. Connect Zendesk and it fills in from your account.
DashboardOperationsZendeskWhat it needs from your data
| Needs | a numeric measure, a category (~6 values) |
|---|---|
| Optional | dates for trends, 10 more |
What is on it
Tickets and speed shown above
- Tickets created over time Area chart
- Tickets solved over time Area chart
- Where tickets come from Donut chart
- Created against solved by channel Combo chart
- Which teams carry the load Pareto chart
- Ticket types by priority Stacked bar chart
Replies, fixes and ratings shown above
- Median first reply by channel Ranking chart
- Median time to solve, by team Ranking chart
- How long tickets take, by priority Box plot
- Reply time against time to solve, by team Scatter plot
- Good against bad ratings Donut chart
- Channel against priority Heatmap