← All templates
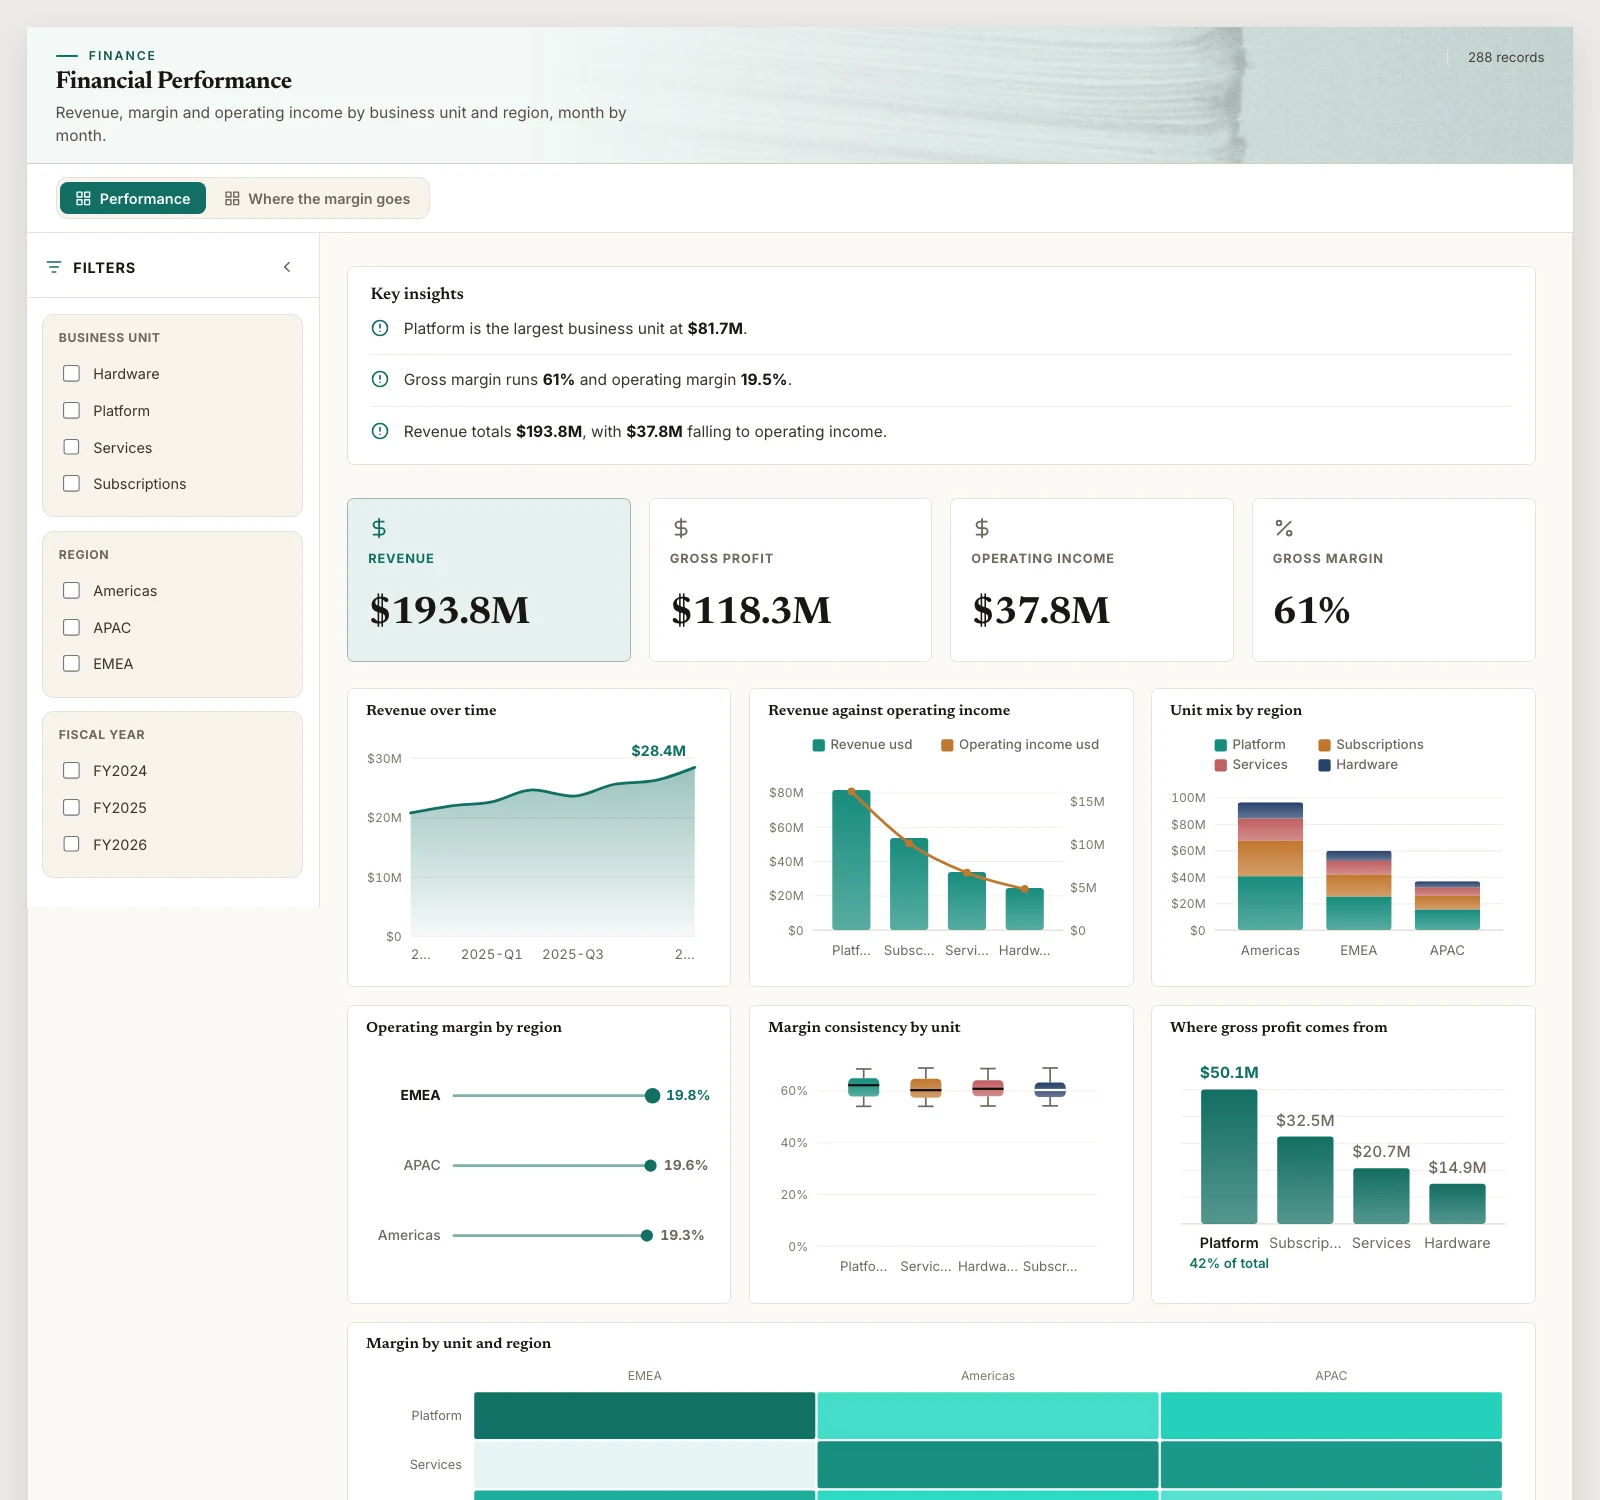
Shown on sample data. The figures are illustrative, not real business results — take the template and point it at your own.
Financial Performance
Revenue, margin and operating income by business unit and region, month by month.
DashboardFinanceAny industryWhat it needs from your data
| Needs | a revenue or money column, a category (~4 values) |
|---|---|
| Optional | dates for trends, 8 more |
What is on it
Performance shown above
- Revenue over time Area chart
- Revenue against operating income Combo chart
- Unit mix by region Stacked bar chart
- Operating margin by region Ranking chart
- Margin consistency by unit Box plot
- Where gross profit comes from Waterfall chart
- Margin by unit and region Heatmap
Where the margin goes shown above
- Where operating cost concentrates Pareto chart
- Margin over time Area chart
- Gross against operating margin Dumbbell chart
- Cost of sales by unit Ranking chart
- Which units hold their margin Scatter plot
- Cost mix by unit and region Marimekko
- From revenue to operating income Waterfall chart