← All templates
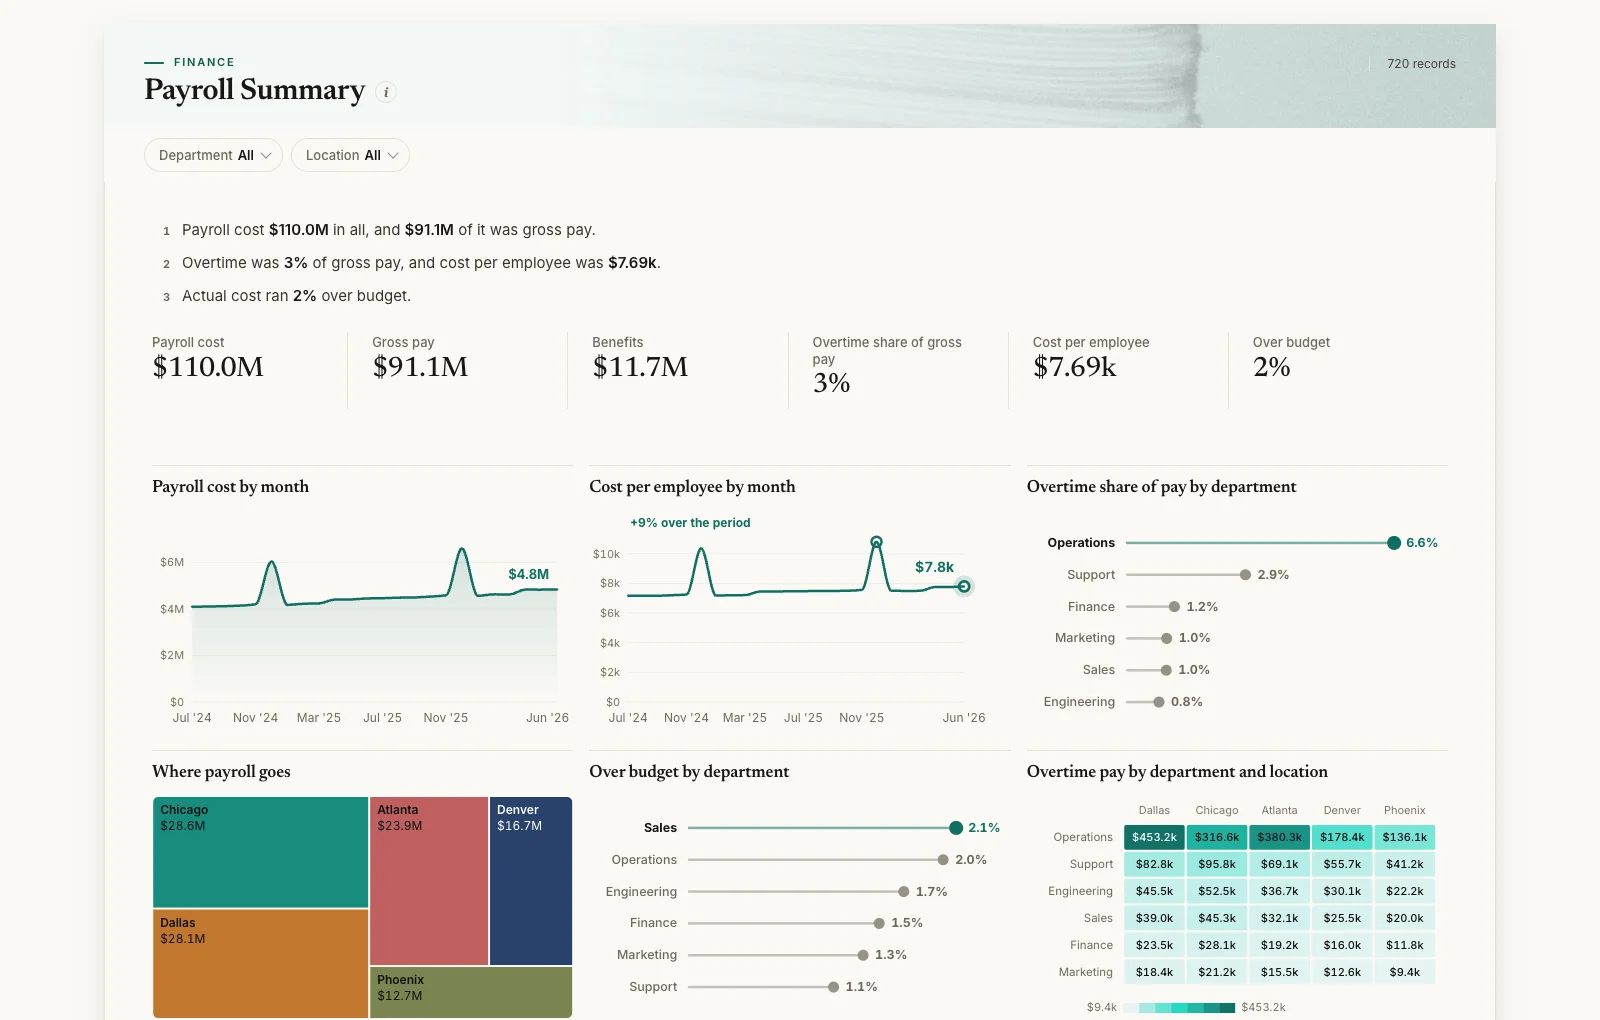
Shown on sample data. The figures are illustrative, not real business results — take the template and point it at your own.
Payroll Summary
What did payroll cost, how much was overtime and where, and how does it compare with budget?
DashboardFinanceAny industryWhat it needs from your data
| Needs | a revenue or money column, a category (~6 values) |
|---|---|
| Optional | dates for trends, 7 more |
What is on it
- Payroll cost by month Area chart
- Cost per employee by month Line chart
- Overtime share of pay by department Ranking chart
- Where payroll goes Treemap
- Over budget by department Ranking chart
- Overtime pay by department and location Heatmap