← All templates
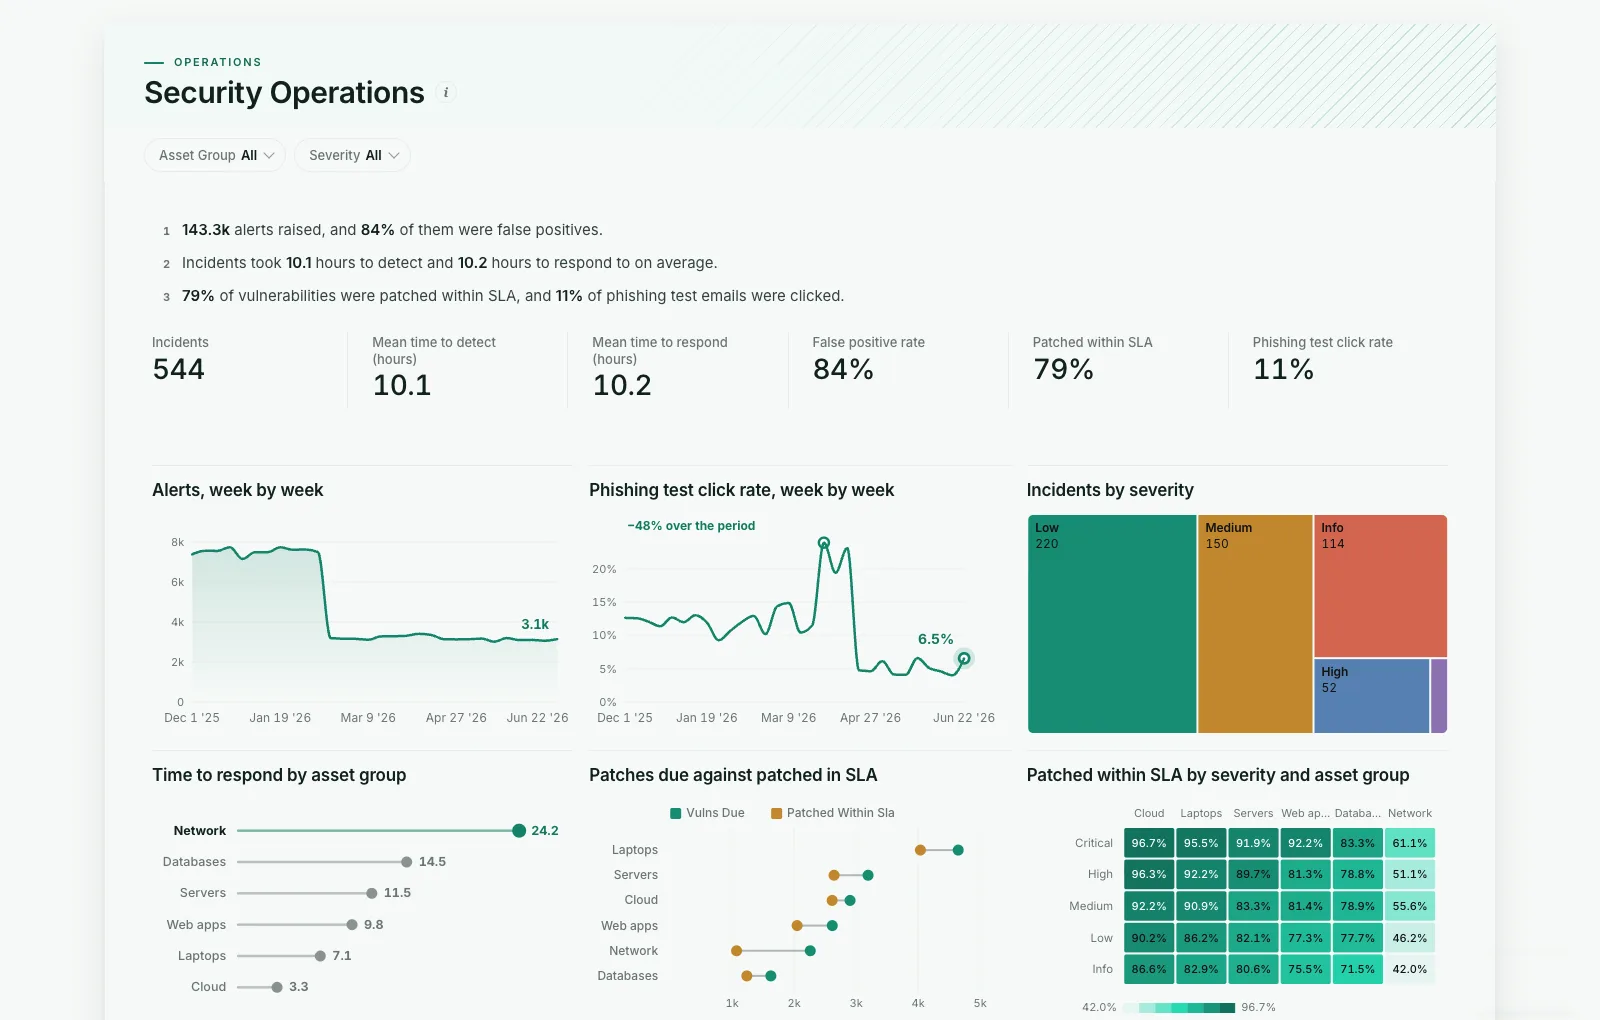
Shown on sample data. The figures are illustrative, not real business results — take the template and point it at your own.
Security Operations
How many alerts are real, how fast are incidents handled, which assets miss their patch deadlines, and who clicks a phishing test?
DashboardOperationsAny industryWhat it needs from your data
| Needs | a score column, a category (~6 values) |
|---|---|
| Optional | dates for trends, 10 more |
What is on it
- Alerts, week by week Area chart
- Phishing test click rate, week by week Line chart
- Incidents by severity Treemap
- Time to respond by asset group Ranking chart
- Patches due against patched in SLA Dumbbell chart
- Patched within SLA by severity and asset group Heatmap