← All templates
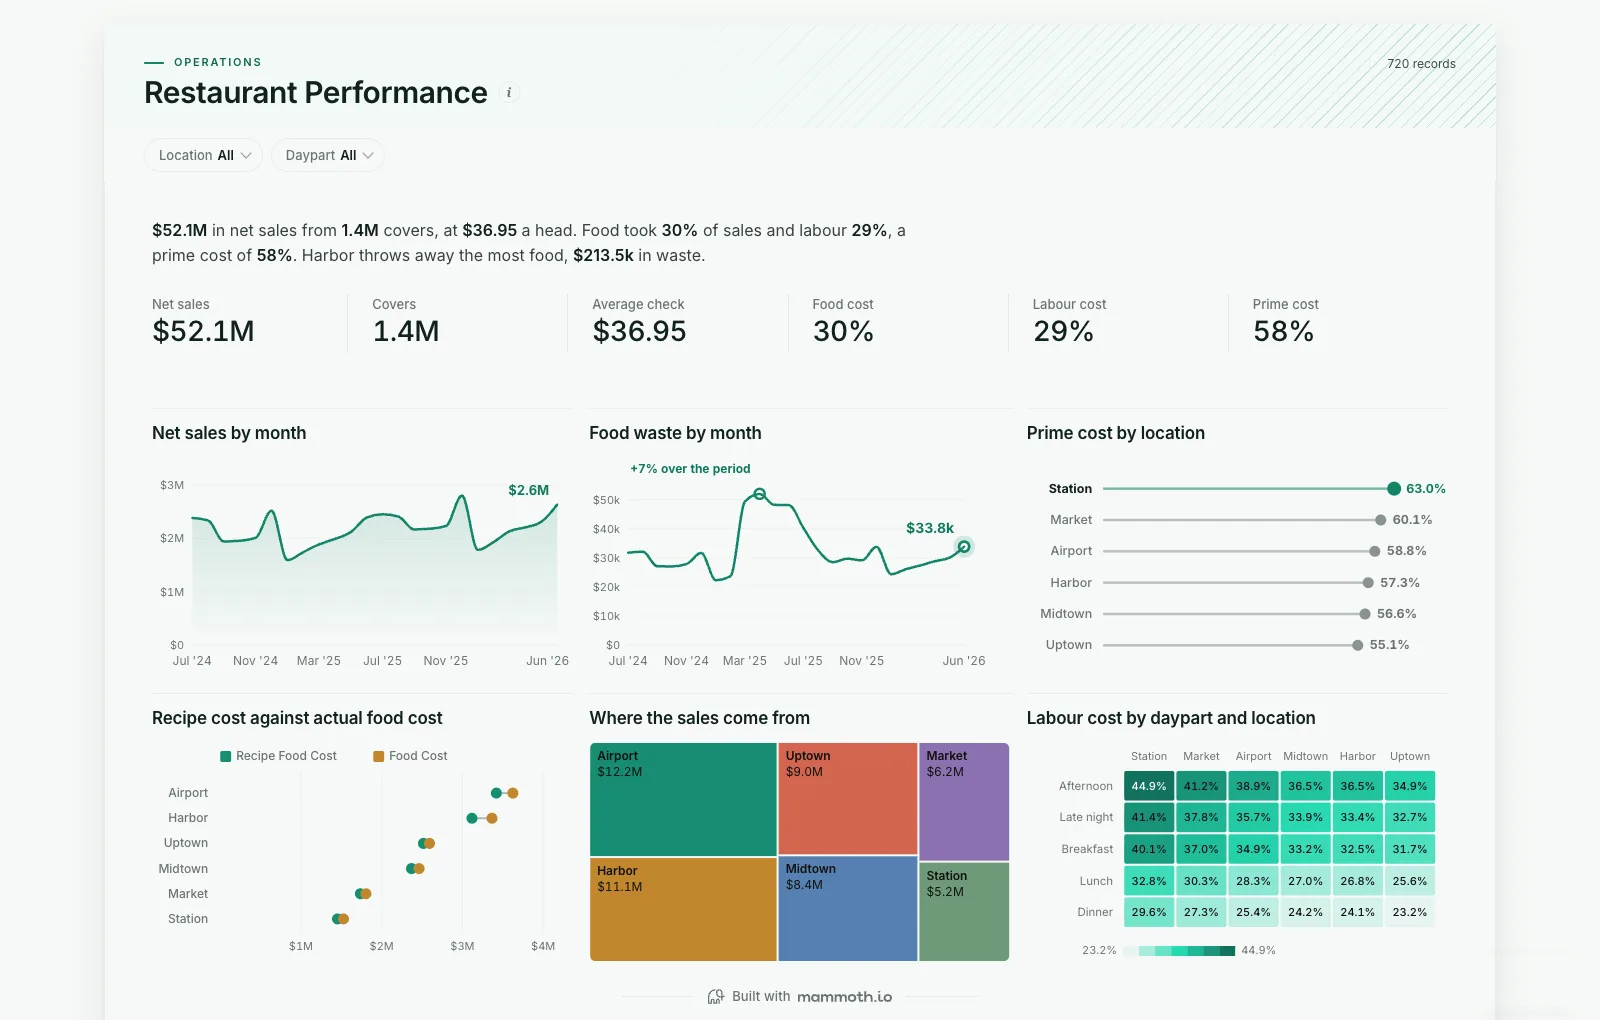
Shown on sample data. The figures are illustrative, not real business results — take the template and point it at your own.
Restaurant Performance
Are we busy, are we making money on each cover, and where do food and labour costs run away?
DashboardOperationsAny industryWhat it needs from your data
| Needs | a revenue or money column, a category (~6 values) |
|---|---|
| Optional | dates for trends, 8 more |
What is on it
- Net sales by month Area chart
- Food waste by month Line chart
- Prime cost by location Ranking chart
- Recipe cost against actual food cost Dumbbell chart
- Where the sales come from Treemap
- Labour cost by daypart and location Heatmap