← All templates
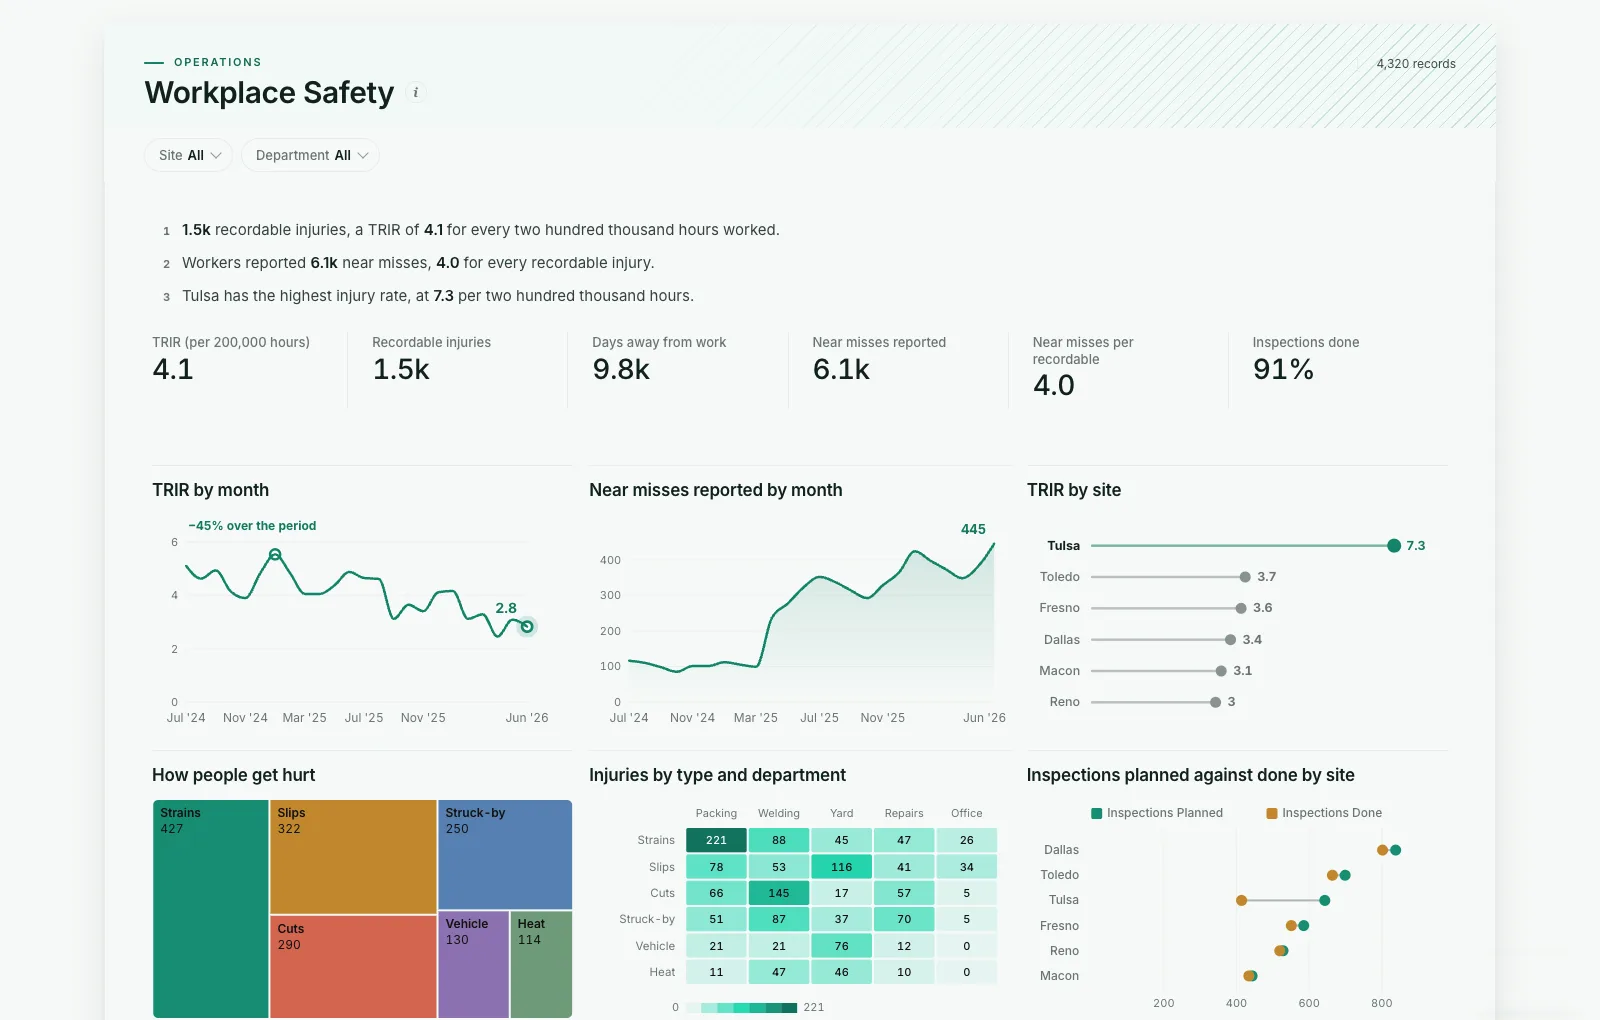
Shown on sample data. The figures are illustrative, not real business results — take the template and point it at your own.
Workplace Safety
Are we getting safer, where do people get hurt, and are we catching hazards before they become injuries?
DashboardOperationsAny industryWhat it needs from your data
| Needs | a score column, a category (~6 values) |
|---|---|
| Optional | dates for trends, 7 more |
What is on it
- TRIR by month Line chart
- Near misses reported by month Area chart
- TRIR by site Ranking chart
- How people get hurt Treemap
- Injuries by type and department Heatmap
- Inspections planned against done by site Dumbbell chart