← All templates
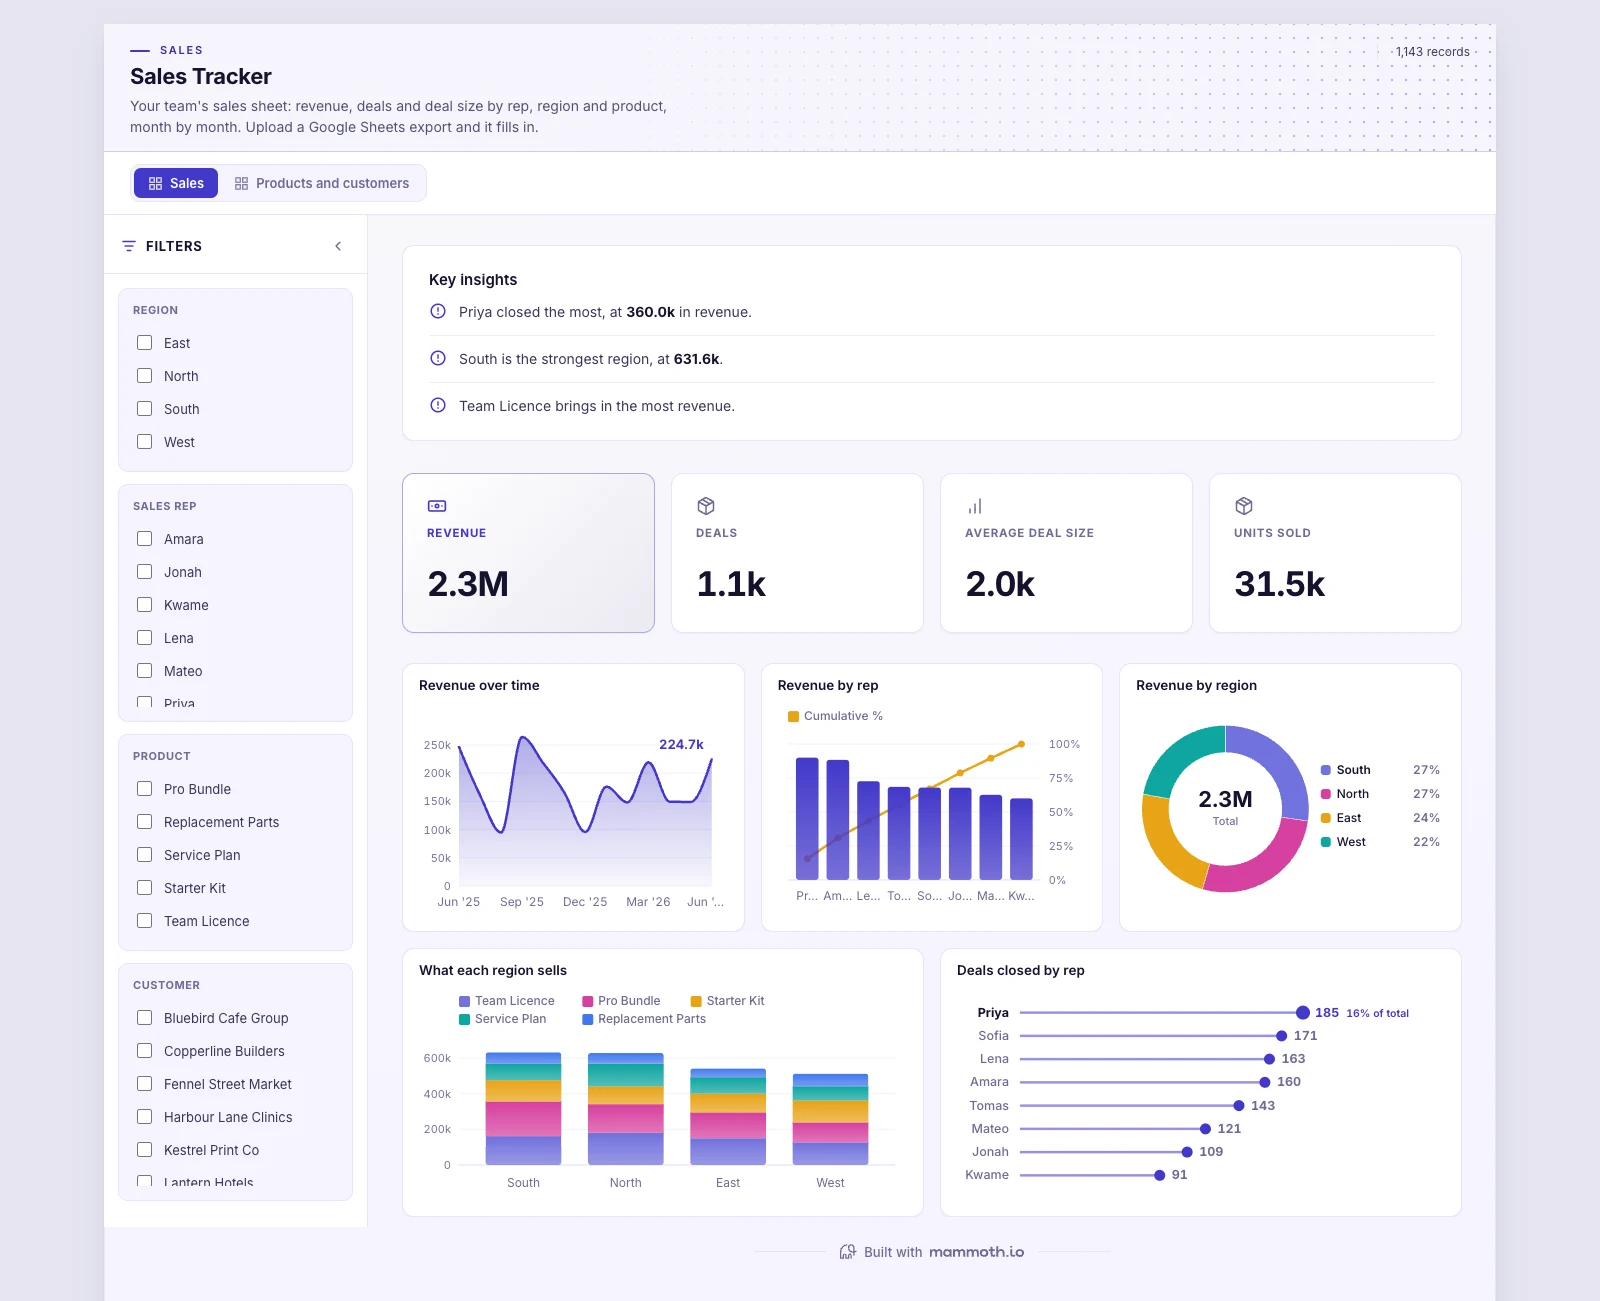
Shown on sample data. The figures are illustrative, not real business results — take the template and point it at your own.
Sales Tracker
Your team's sales sheet: revenue, deals and deal size by rep, region and product, month by month. Upload a Google Sheets export and it fills in.
DashboardSalesGoogle SheetsWhat it needs from your data
| Needs | a revenue or money column, a category (~8 values) |
|---|---|
| Optional | dates for trends, 6 more |
What is on it
Sales shown above
- Revenue over time Area chart
- Revenue by rep Pareto chart
- Revenue by region Donut chart
- What each region sells Stacked bar chart
- Deals closed by rep Ranking chart
Products and customers shown above
- Revenue and units by product Combo chart
- Top customers Pareto chart
- Who sells what Heatmap
- Units sold over time Area chart
- Deals by product Donut chart