← All templates
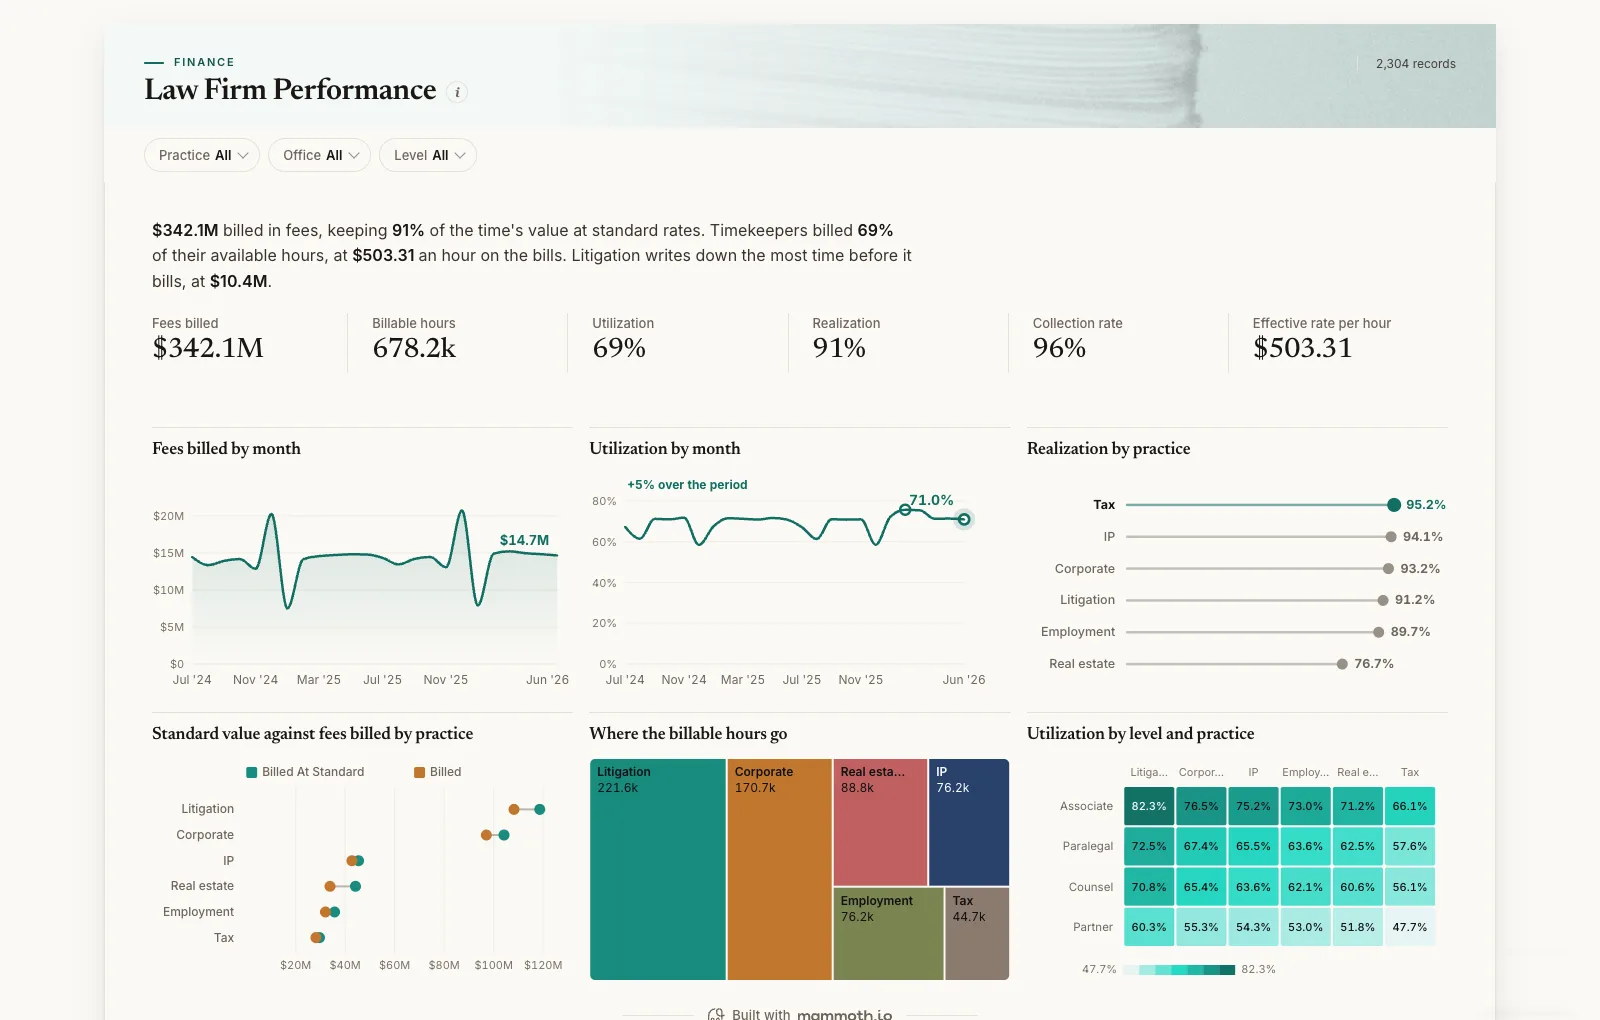
Shown on sample data. The figures are illustrative, not real business results — take the template and point it at your own.
Law Firm Performance
Are lawyers busy, how much of their time turns into fees, and which practice writes the most down?
DashboardFinanceAny industryWhat it needs from your data
| Needs | a revenue or money column, a category (~6 values) |
|---|---|
| Optional | dates for trends, 9 more |
What is on it
- Fees billed by month Area chart
- Utilization by month Line chart
- Realization by practice Ranking chart
- Standard value against fees billed by practice Dumbbell chart
- Where the billable hours go Treemap
- Utilization by level and practice Heatmap