← All templates
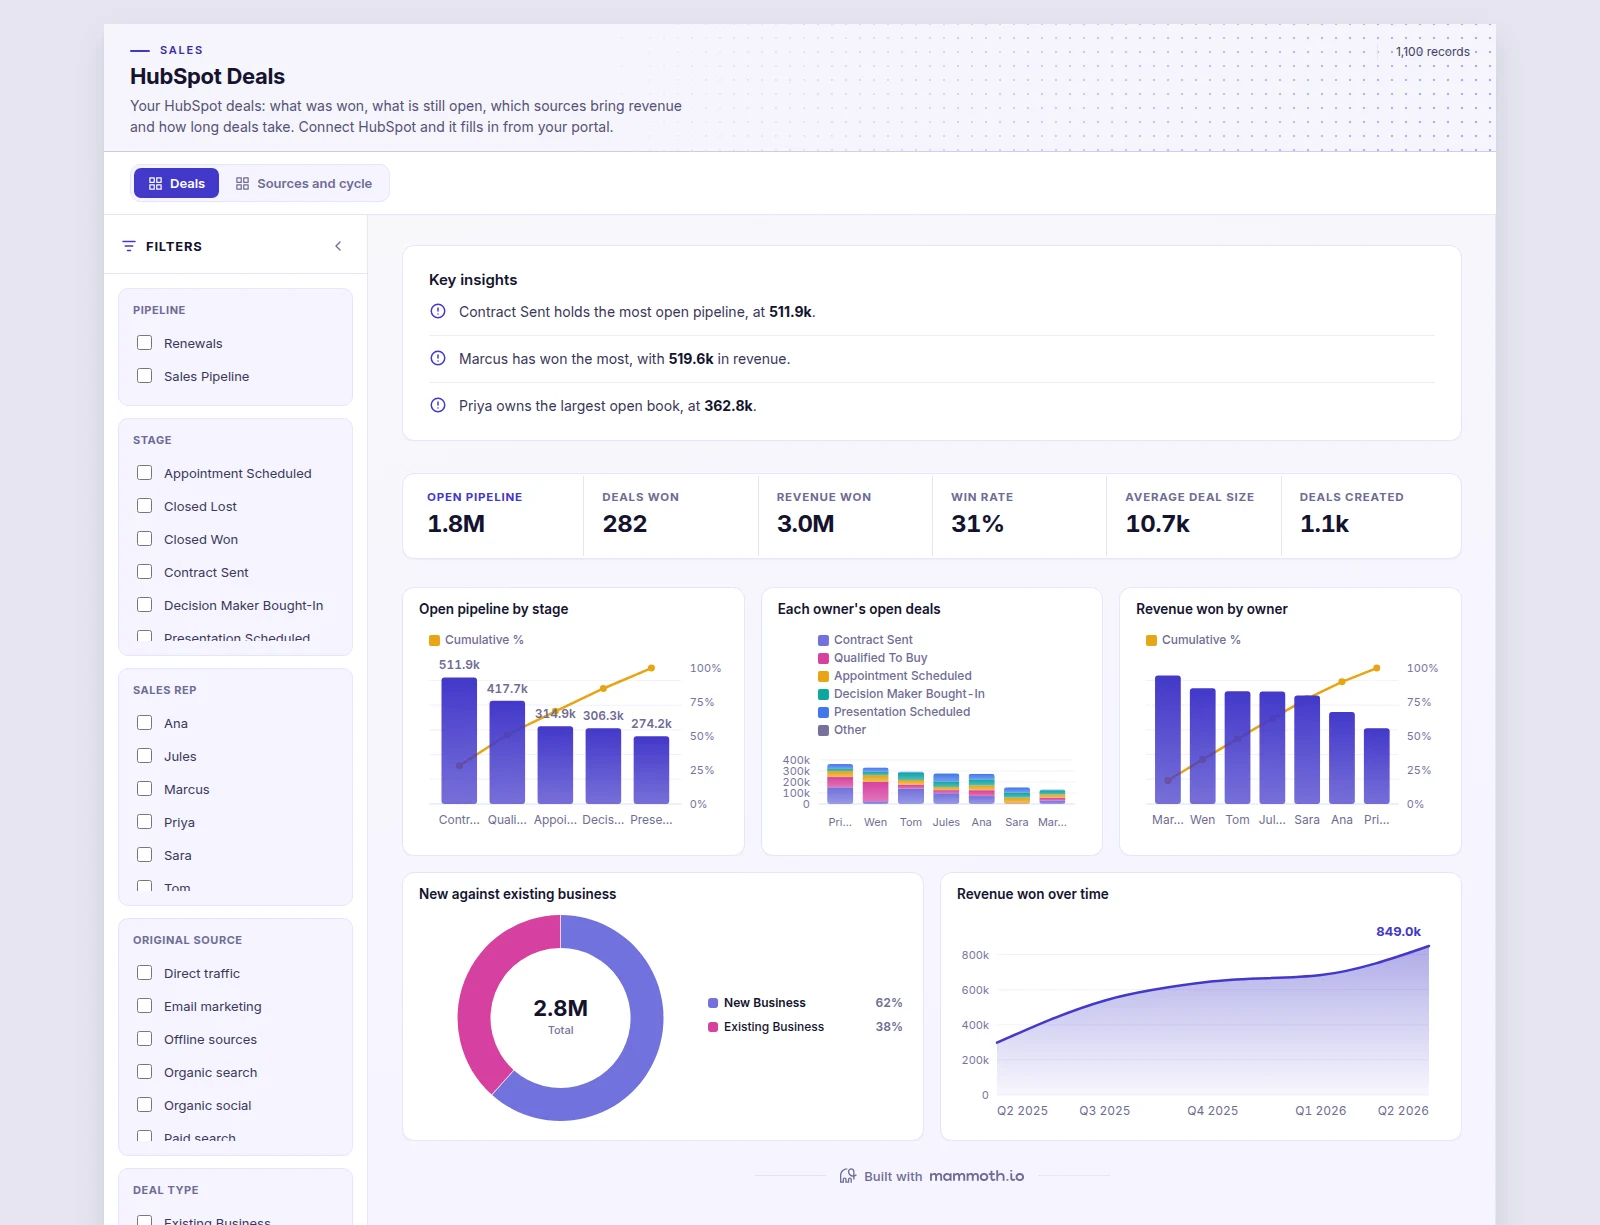
Shown on sample data. The figures are illustrative, not real business results — take the template and point it at your own.
HubSpot Deals
Your HubSpot deals: what was won, what is still open, which sources bring revenue and how long deals take. Connect HubSpot and it fills in from your portal.
DashboardSalesHubSpotWhat it needs from your data
| Needs | a revenue or money column, a category (~7 values) |
|---|---|
| Optional | dates for trends, 13 more |
What is on it
Deals shown above
- Open pipeline by stage Pareto chart
- Each owner's open deals Stacked bar chart
- Revenue won by owner Pareto chart
- New against existing business Donut chart
- Revenue won over time Area chart
Sources and cycle shown above
- Value through the stages Funnel chart
- Won against lost by source Grouped bar chart
- How long each source takes to close Ranking chart
- Cycle length by owner Box plot
- Source against deal type Heatmap
- Deals created over time Area chart