← All templates
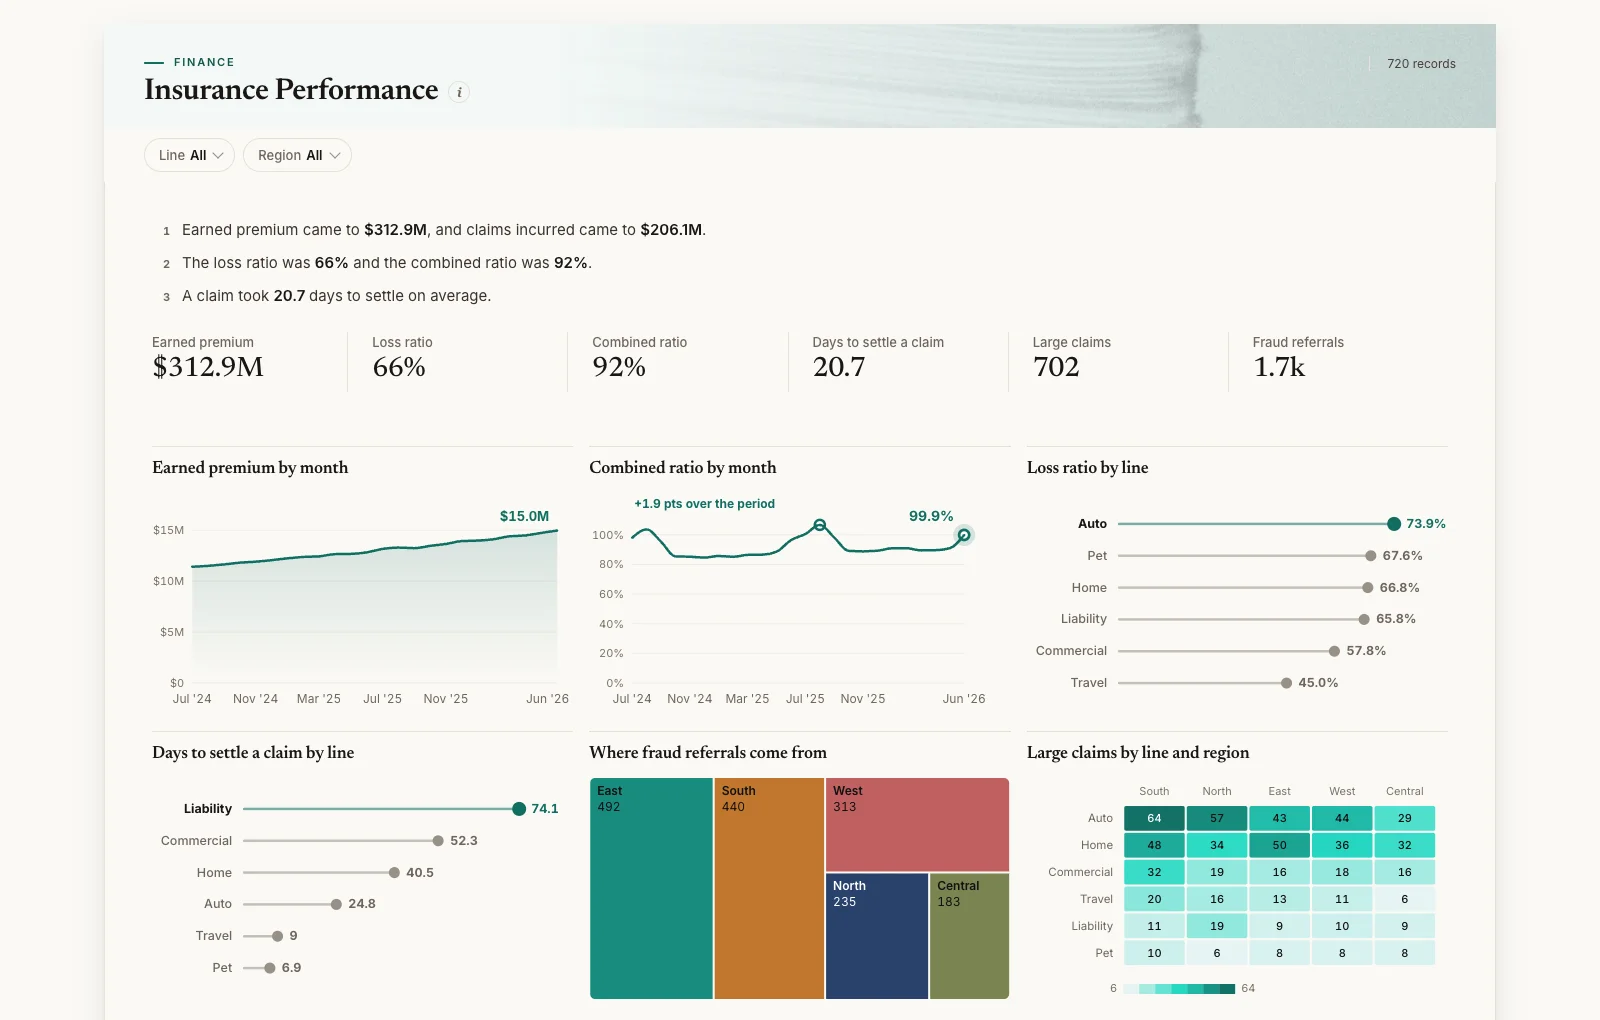
Shown on sample data. The figures are illustrative, not real business results — take the template and point it at your own.
Insurance Performance
Are premiums growing, how much of them goes to claims, how fast are claims settled, and is the combined ratio under 100%?
DashboardFinanceAny industryWhat it needs from your data
| Needs | a revenue or money column, a category (~6 values) |
|---|---|
| Optional | dates for trends, 7 more |
What is on it
- Earned premium by month Area chart
- Combined ratio by month Line chart
- Loss ratio by line Ranking chart
- Days to settle a claim by line Ranking chart
- Where fraud referrals come from Treemap
- Large claims by line and region Heatmap