← All templates
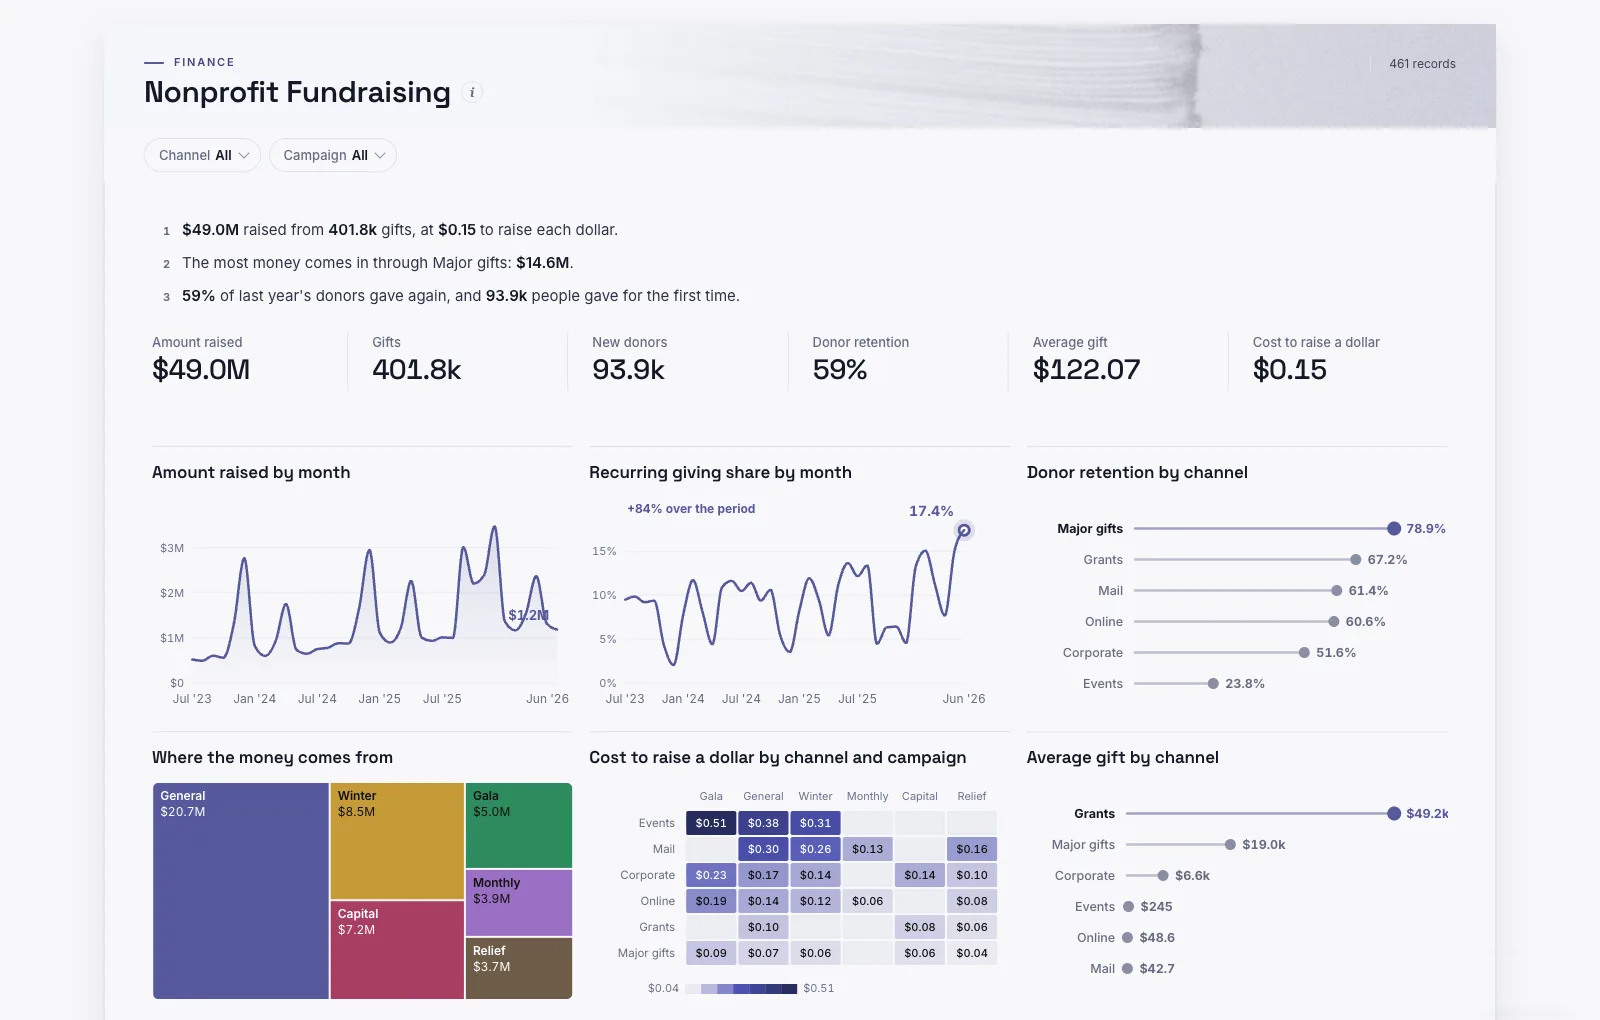
Shown on sample data. The figures are illustrative, not real business results — take the template and point it at your own.
Nonprofit Fundraising
How much did we raise, are donors staying, and which channels and campaigns are worth what they cost?
DashboardFinanceAny industryWhat it needs from your data
| Needs | a revenue or money column, a category (~6 values) |
|---|---|
| Optional | dates for trends, 8 more |
What is on it
- Amount raised by month Area chart
- Recurring giving share by month Line chart
- Donor retention by channel Ranking chart
- Where the money comes from Treemap
- Cost to raise a dollar by channel and campaign Heatmap
- Average gift by channel Ranking chart