← All templates
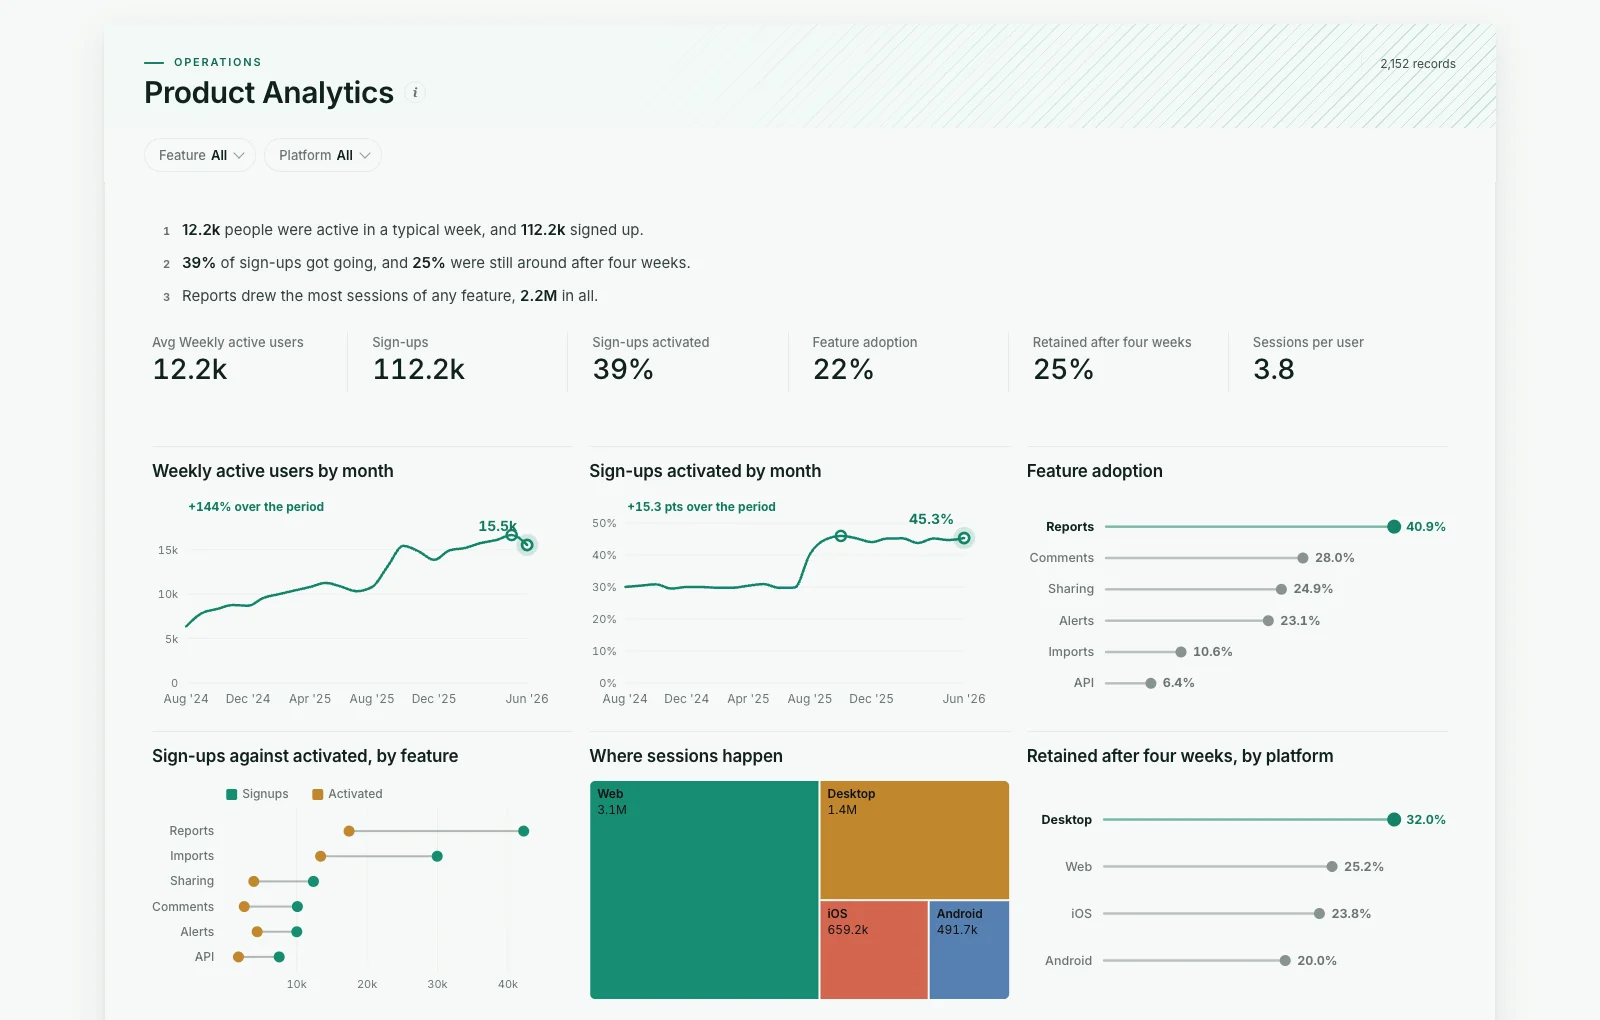
Shown on sample data. The figures are illustrative, not real business results — take the template and point it at your own.
Product Analytics
How many people use the product, do sign-ups get going, which features stick, and which platforms keep people?
DashboardOperationsSaaSWhat it needs from your data
| Needs | a count column, a category (~6 values) |
|---|---|
| Optional | dates for trends, 8 more |
What is on it
- Weekly active users by month Line chart
- Sign-ups activated by month Line chart
- Feature adoption Ranking chart
- Sign-ups against activated, by feature Dumbbell chart
- Where sessions happen Treemap
- Retained after four weeks, by platform Ranking chart