← All templates
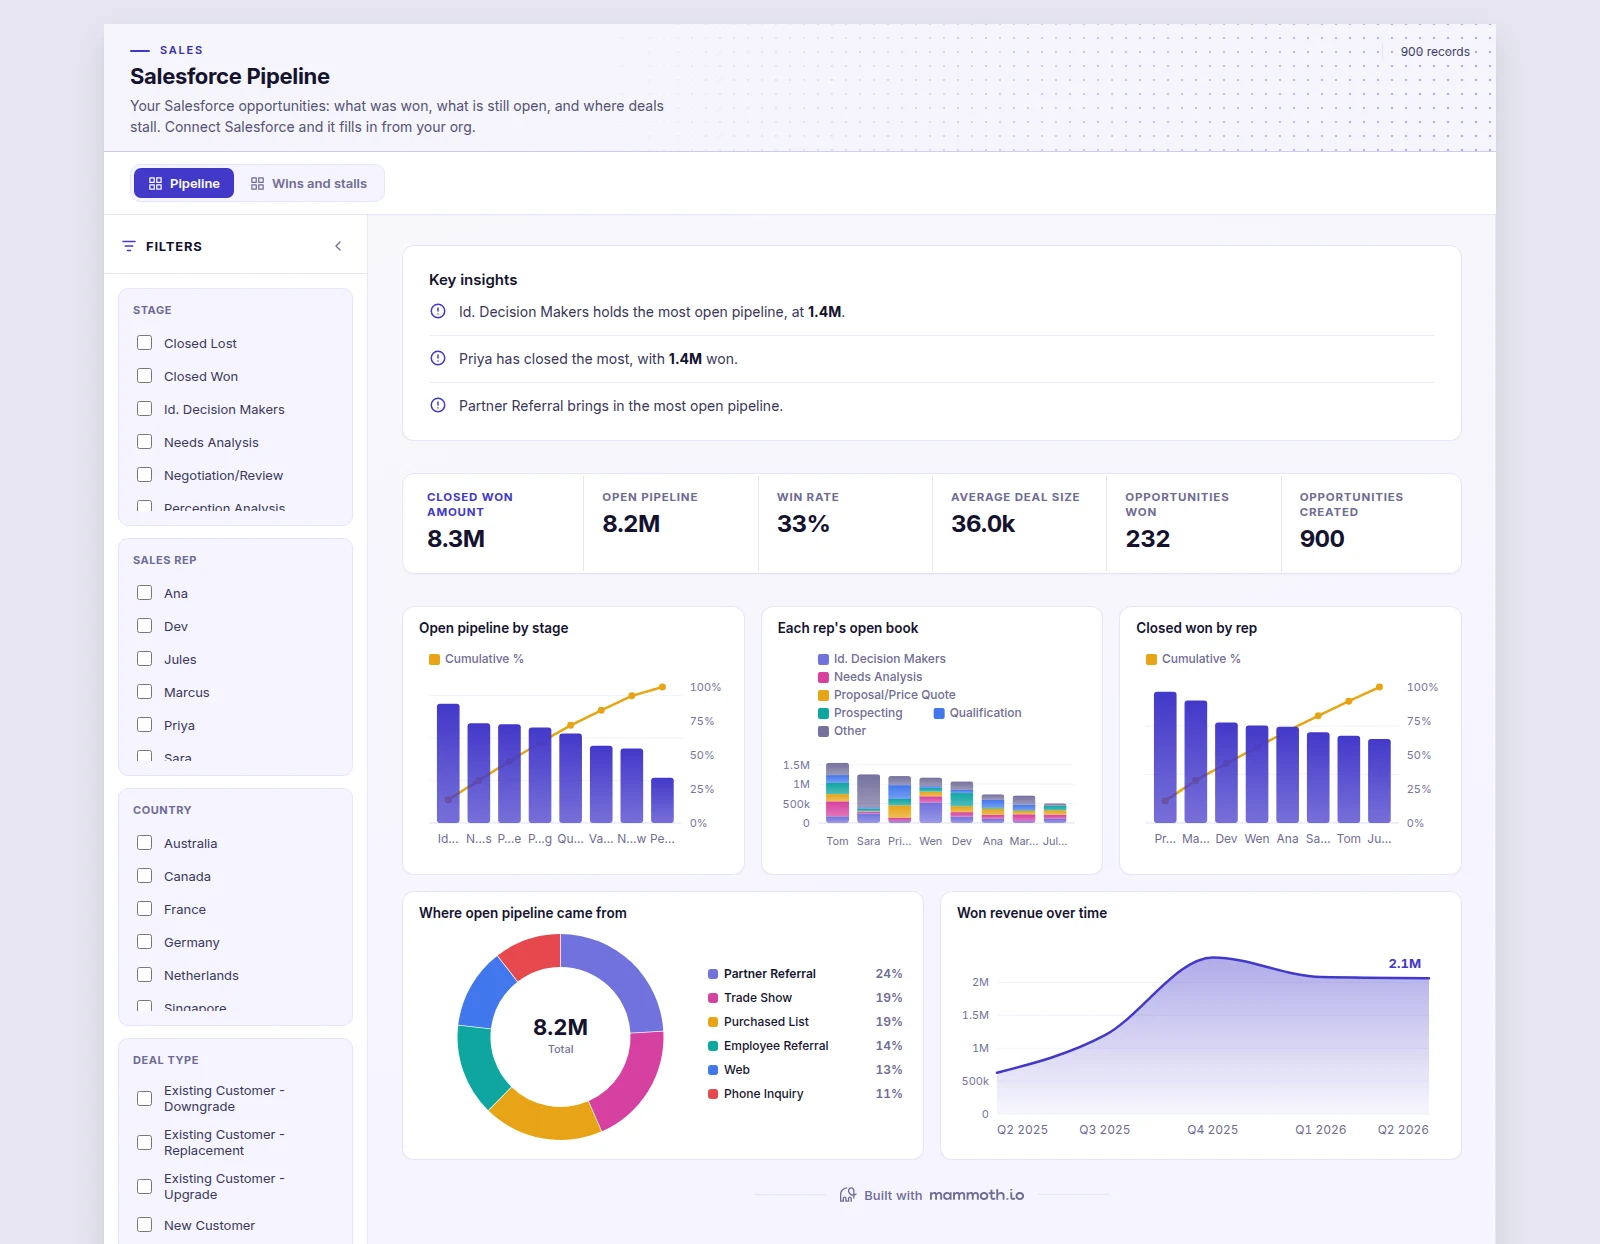
Shown on sample data. The figures are illustrative, not real business results — take the template and point it at your own.
Salesforce Pipeline
Your Salesforce opportunities: what was won, what is still open, and where deals stall. Connect Salesforce and it fills in from your org.
DashboardSalesSalesforceWhat it needs from your data
| Needs | a revenue or money column, a category (~10 values) |
|---|---|
| Optional | dates for trends, 14 more |
What is on it
Pipeline shown above
- Open pipeline by stage Pareto chart
- Each rep's open book Stacked bar chart
- Closed won by rep Pareto chart
- Where open pipeline came from Donut chart
- Won revenue over time Area chart
Wins and stalls shown above
- Value through the stages Funnel chart
- How long deals take to close, by stage Box plot
- Size against cycle length Scatter plot
- Weighted against gross by stage Combo chart
- Cycle length by rep Dumbbell chart
- Pipeline created over time Area chart