← All templates
Shown on sample data. The figures are illustrative, not real business results — take the template and point it at your own.
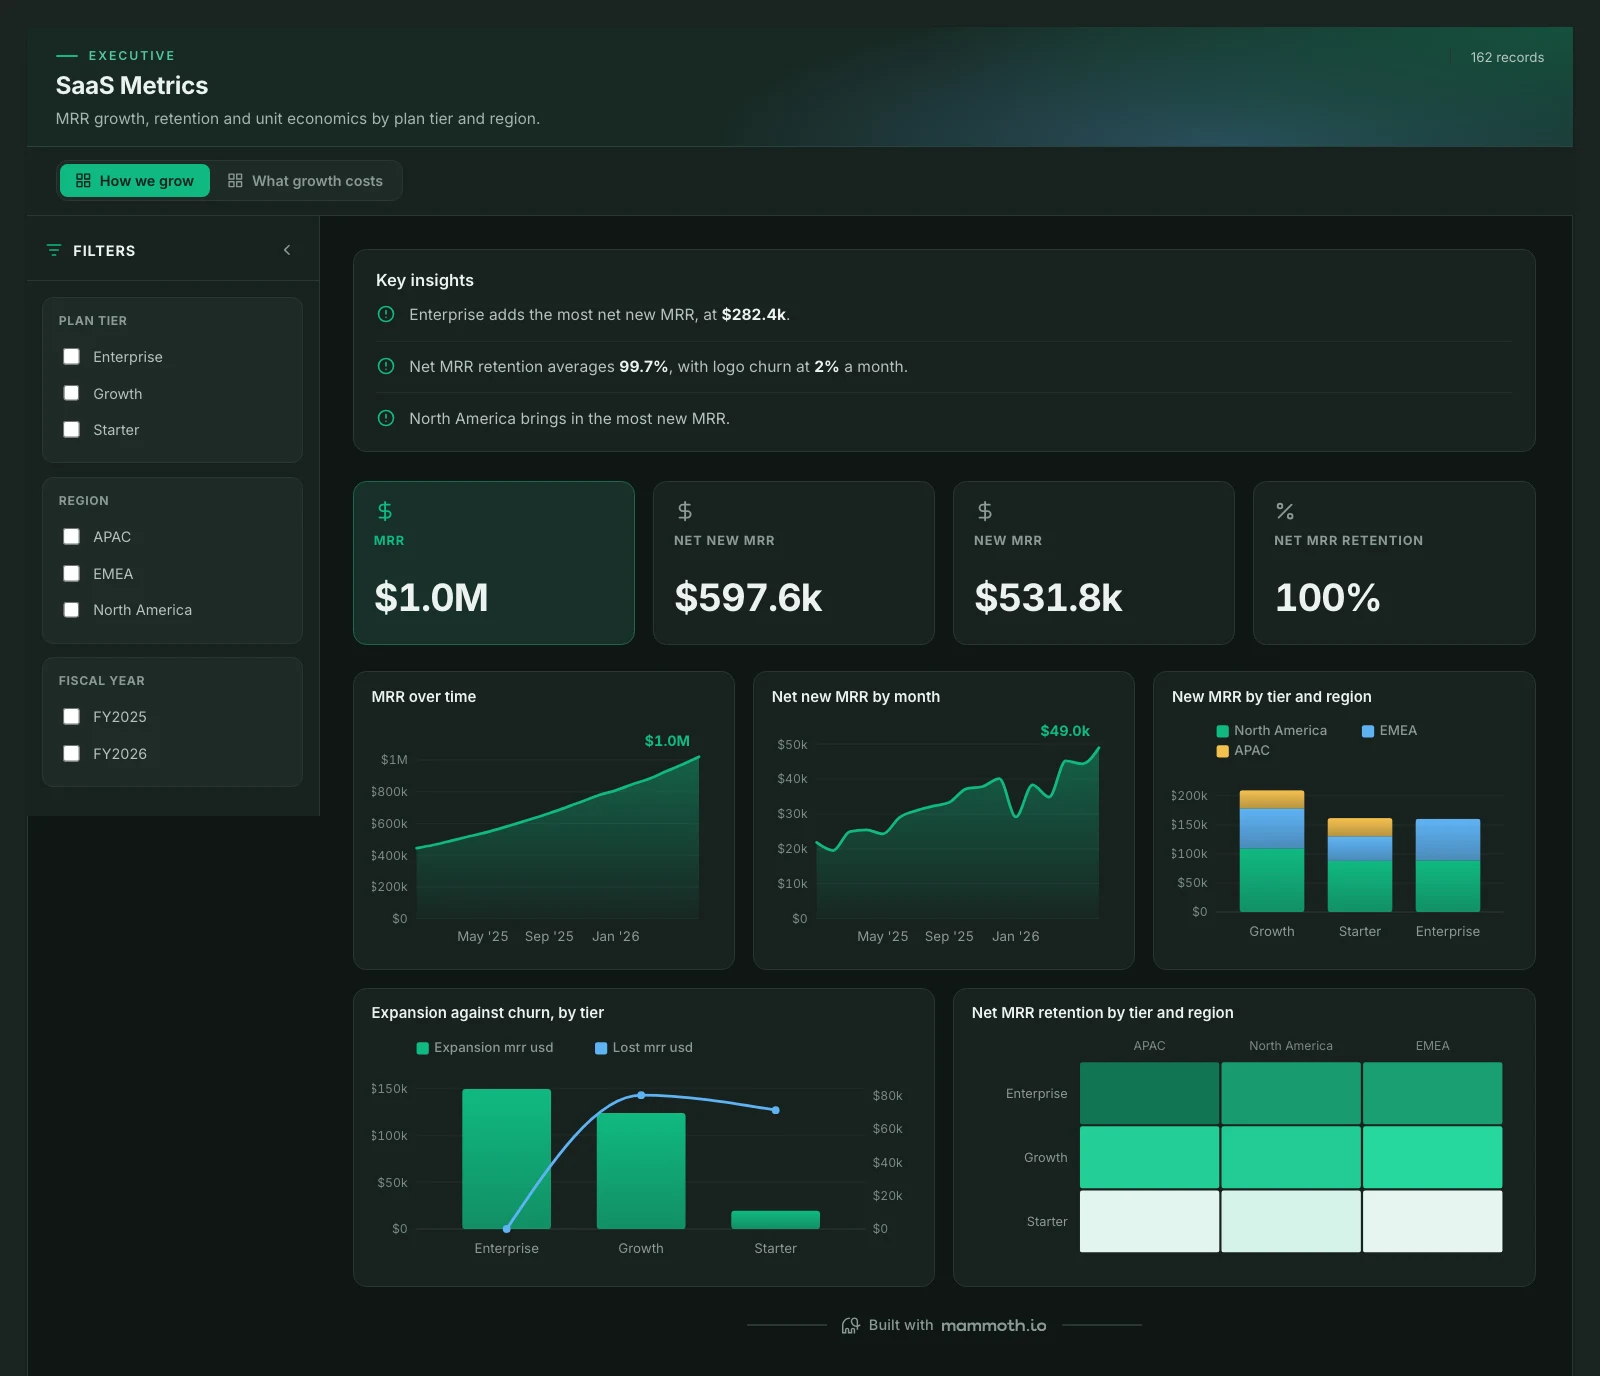
SaaS Metrics
MRR growth, retention and unit economics by plan tier and region.
DashboardExecutiveSaaSWhat it needs from your data
| Needs | a revenue or money column, a category (~3 values) |
|---|---|
| Optional | dates for trends, 14 more |
What is on it
How we grow shown above
- MRR over time Area chart
- Net new MRR by month Area chart
- New MRR by tier and region Stacked bar chart
- Expansion against churn, by tier Combo chart
- Net MRR retention by tier and region Heatmap
What growth costs shown above
- Net burn by month Area chart
- Cost to acquire a customer, by tier Ranking chart
- Where revenue comes from Treemap
- Monthly churn spread by tier Box plot
- Revenue against sales and marketing spend Combo chart