← All templates
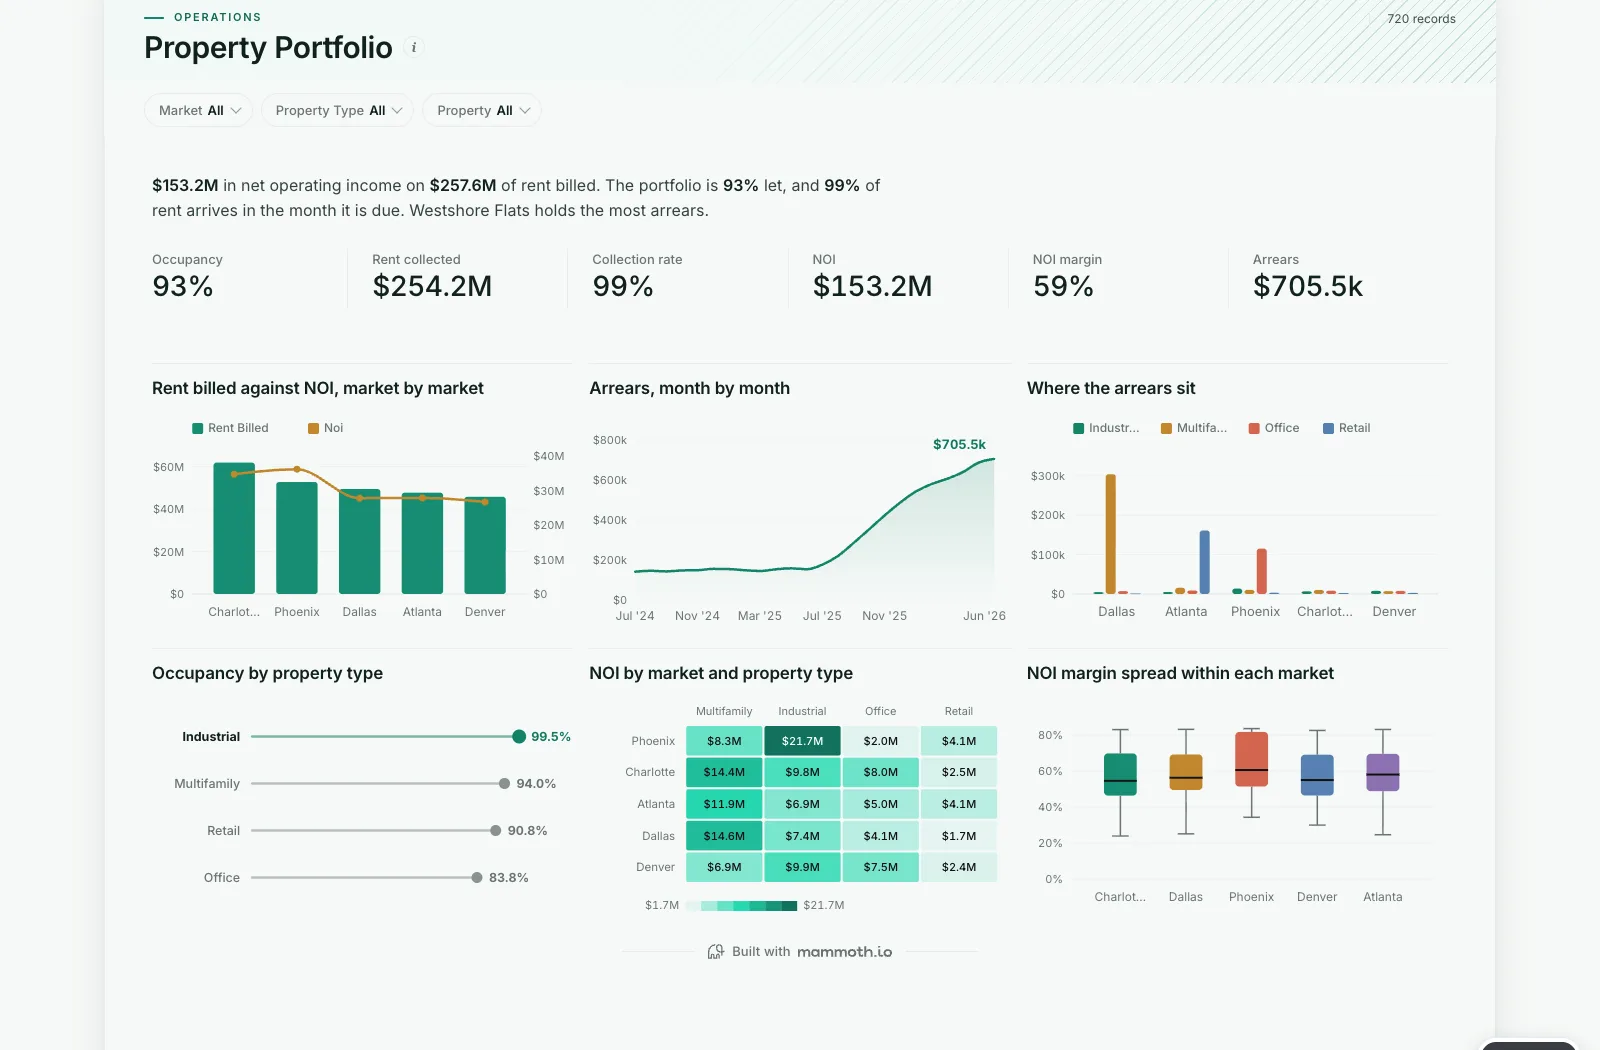
Shown on sample data. The figures are illustrative, not real business results — take the template and point it at your own.
Property Portfolio
Are the buildings full, is the rent coming in, and which properties earn their keep?
DashboardOperationsReal estateWhat it needs from your data
| Needs | a revenue or money column, a category (~5 values) |
|---|---|
| Optional | dates for trends, 8 more |
What is on it
- Rent billed against NOI, market by market Combo chart
- Arrears, month by month Area chart
- Where the arrears sit Grouped bar chart
- Occupancy by property type Ranking chart
- NOI by market and property type Heatmap
- NOI margin spread within each market Box plot