← All templates
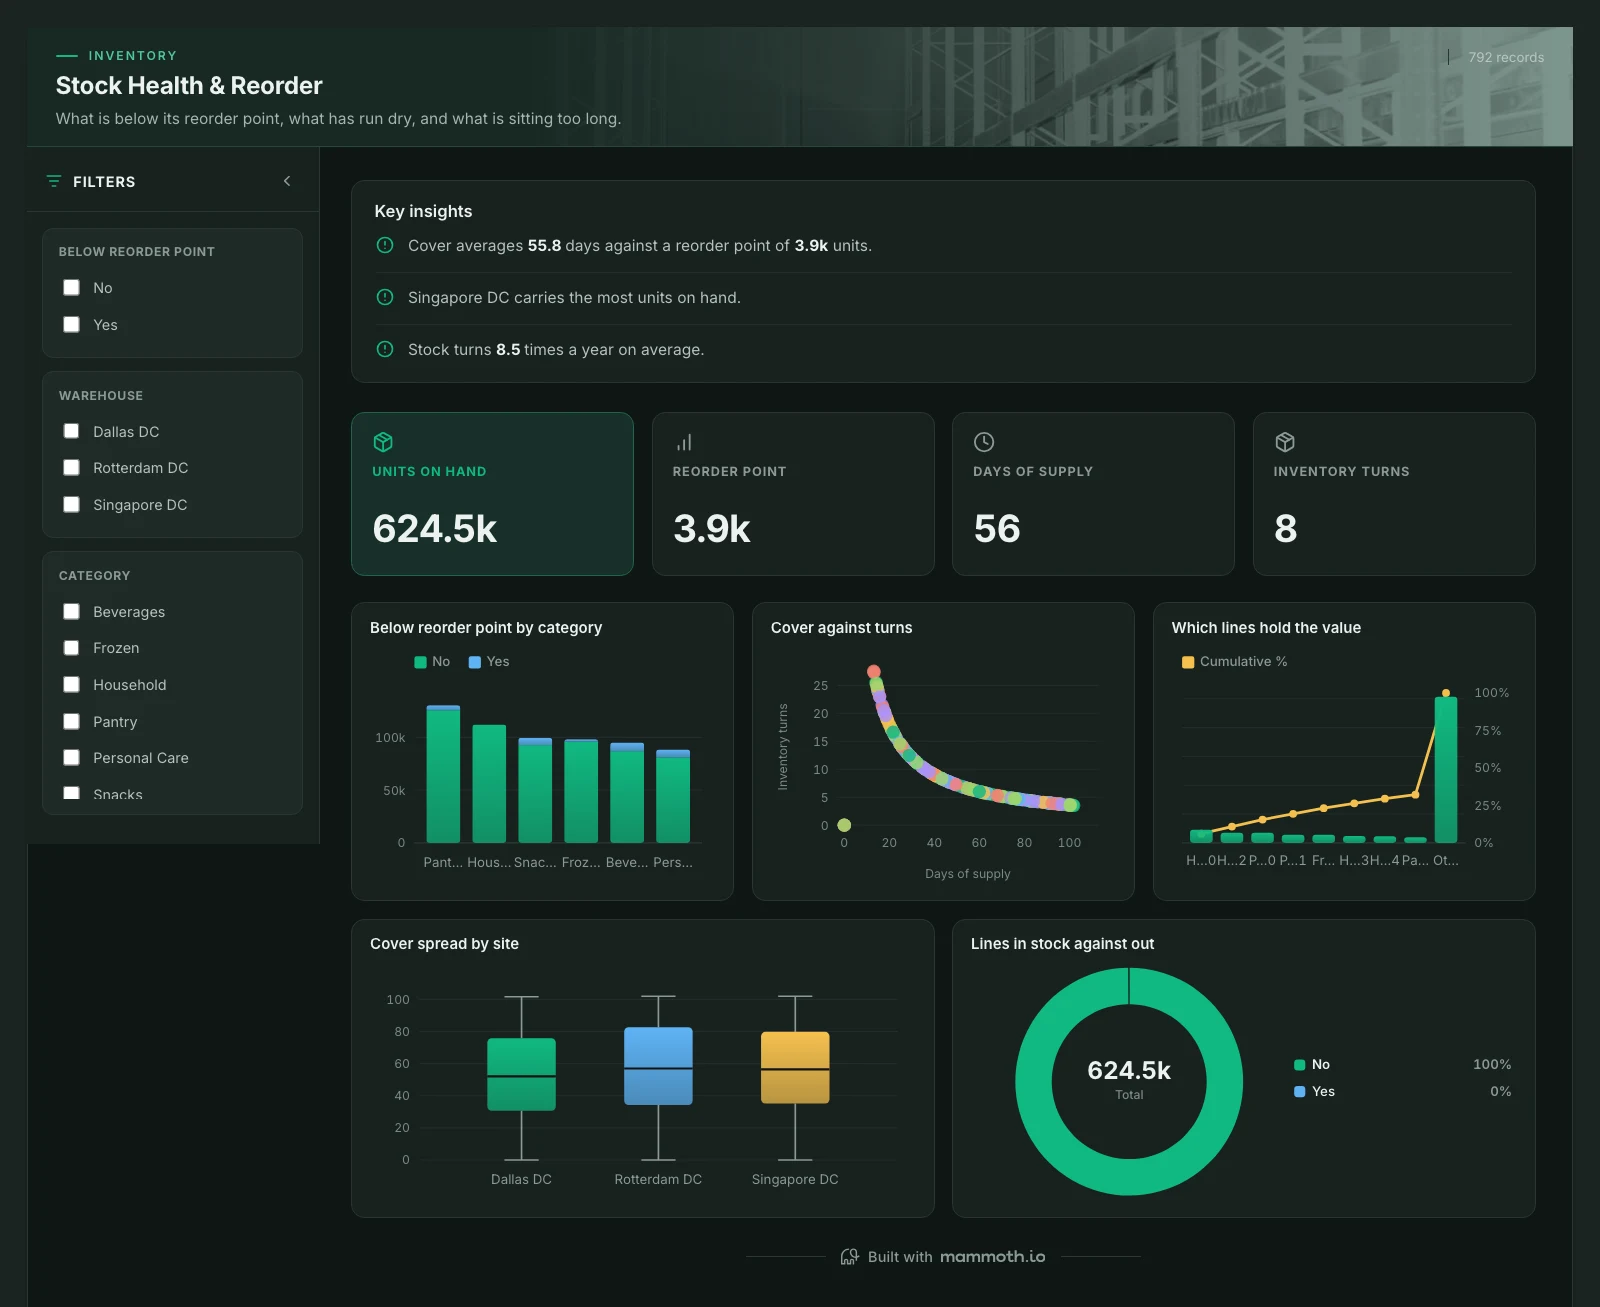
Shown on sample data. The figures are illustrative, not real business results — take the template and point it at your own.
Stock Health & Reorder
What is below its reorder point, what has run dry, and what is sitting too long.
DashboardInventoryAny industryWhat it needs from your data
| Needs | a count column, a category (~2 values) |
|---|---|
| Optional | 8 more |
What is on it
- Below reorder point by category Stacked bar chart
- Cover against turns Scatter plot
- Which lines hold the value Pareto chart
- Cover spread by site Box plot
- Lines in stock against out Donut chart