← All templates
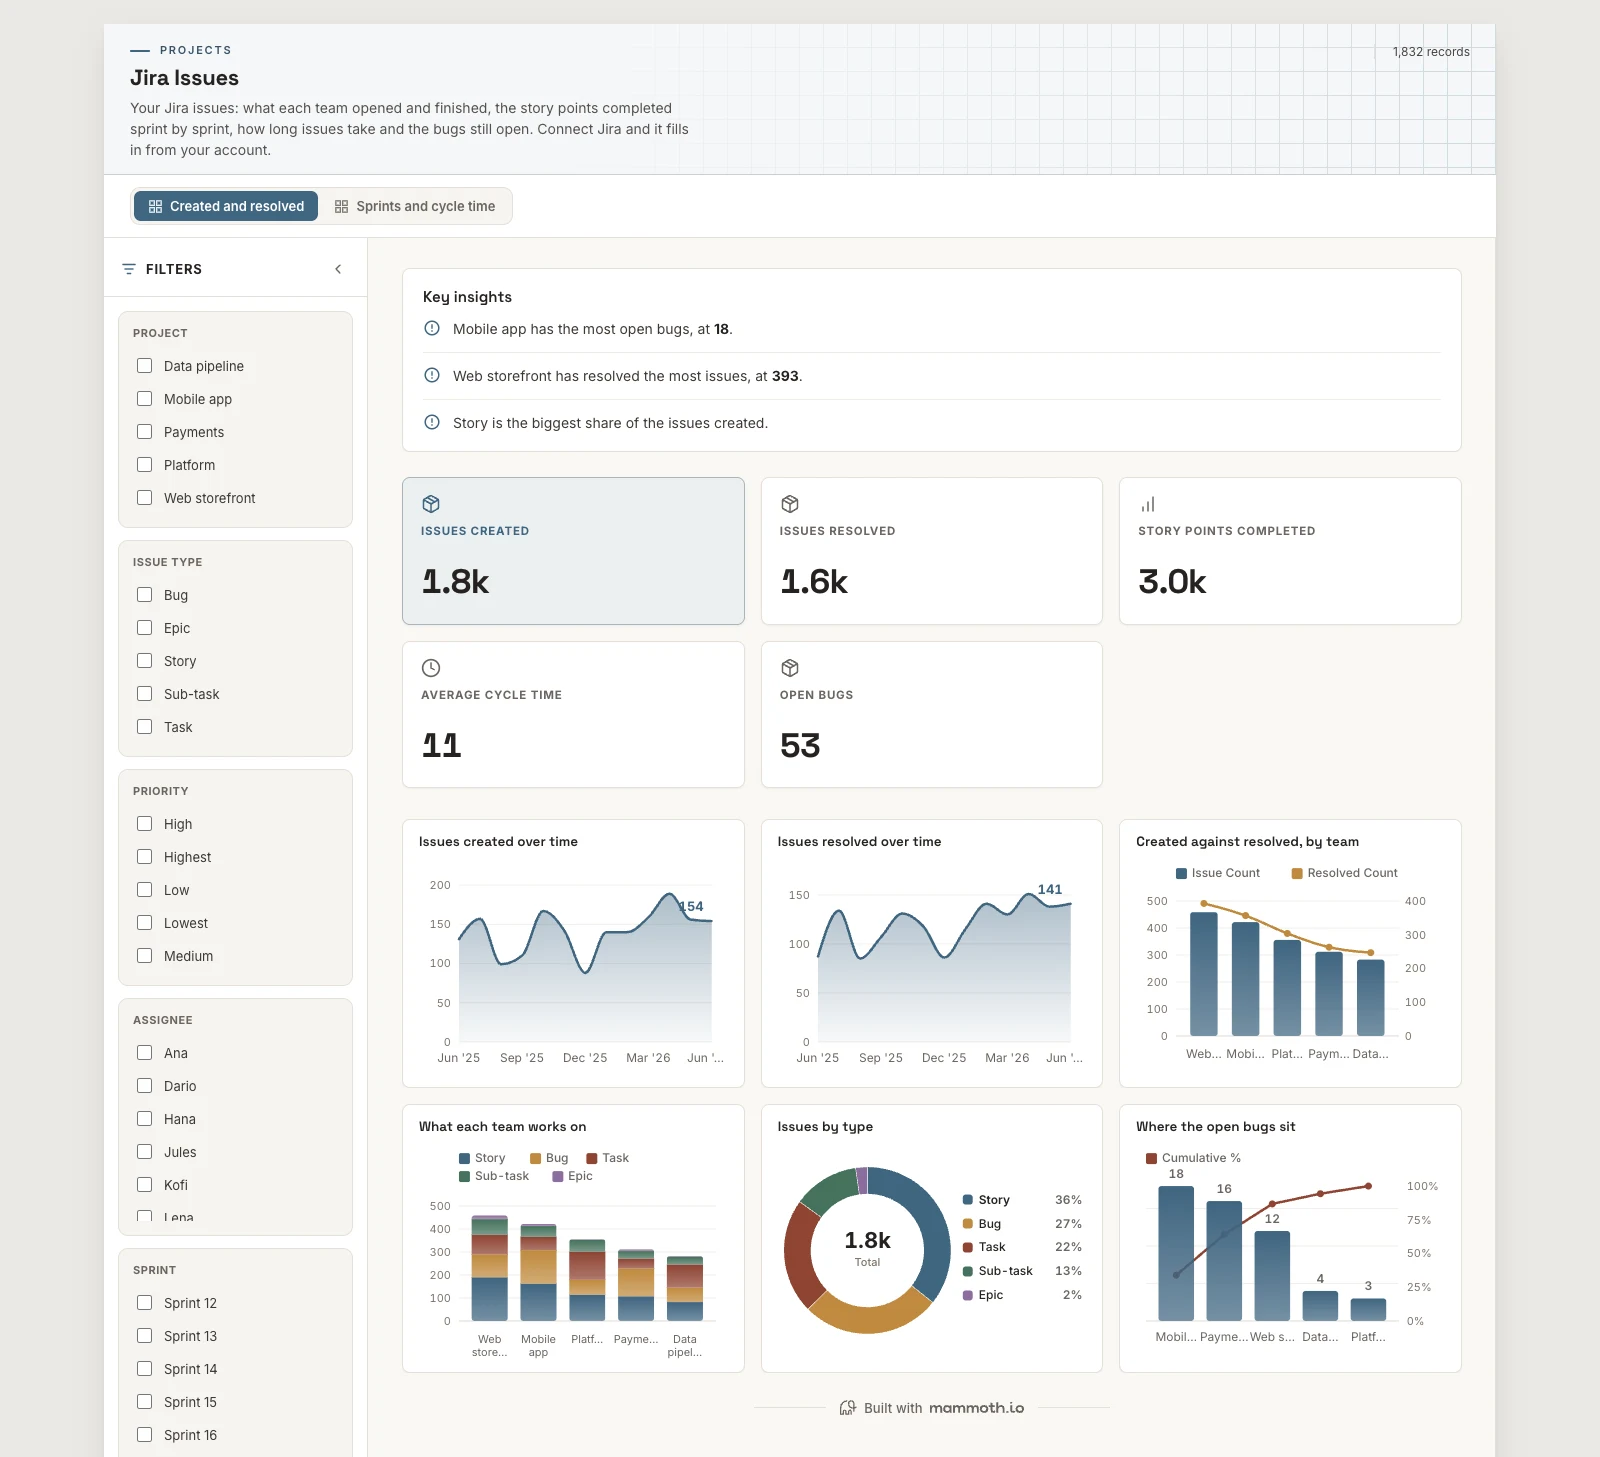
Shown on sample data. The figures are illustrative, not real business results — take the template and point it at your own.
Jira Issues
Your Jira issues: what each team opened and finished, the story points completed sprint by sprint, how long issues take and the bugs still open. Connect Jira and it fills in from your account.
DashboardProjectJiraWhat it needs from your data
| Needs | a numeric measure, a category (~5 values) |
|---|---|
| Optional | dates for trends, 9 more |
What is on it
Created and resolved shown above
- Issues created over time Area chart
- Issues resolved over time Area chart
- Created against resolved, by team Combo chart
- What each team works on Stacked bar chart
- Issues by type Donut chart
- Where the open bugs sit Pareto chart
Sprints and cycle time shown above
- Story points completed, sprint by sprint Stacked bar chart
- Who completes the points Pareto chart
- Cycle time by issue type Box plot
- How long each team takes Ranking chart
- Open bugs by team and priority Heatmap