← All templates
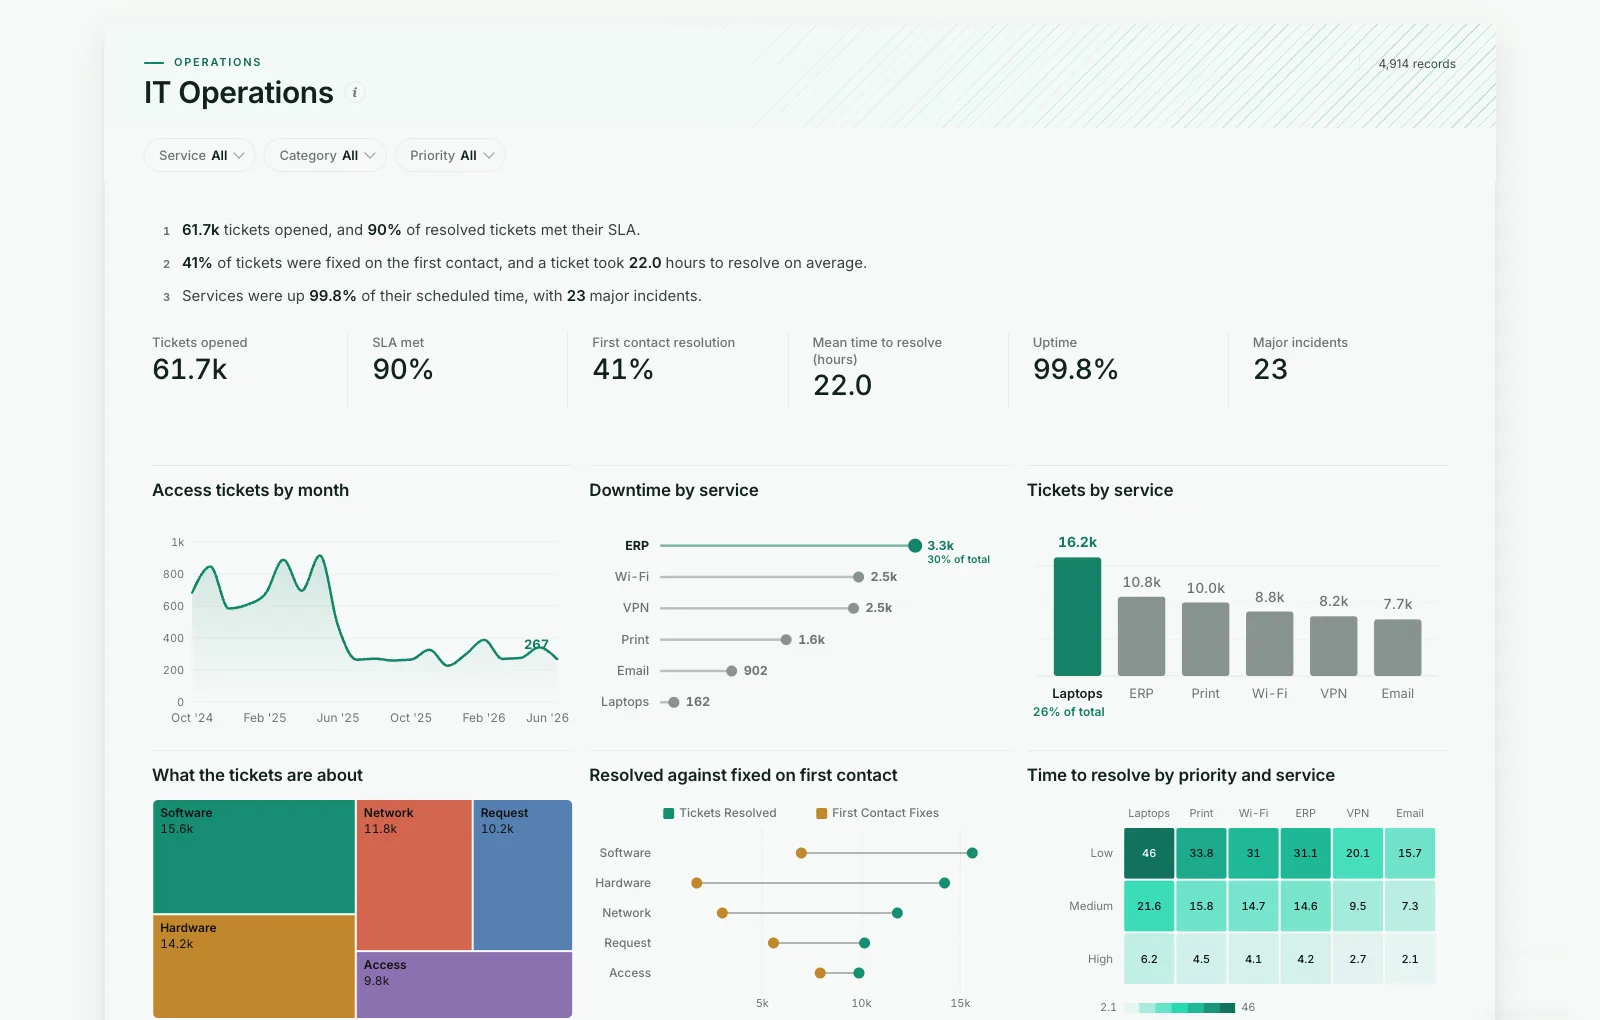
Shown on sample data. The figures are illustrative, not real business results — take the template and point it at your own.
IT Operations
Are our services up, is the service desk keeping up, and which services bring in the work?
DashboardOperationsAny industryWhat it needs from your data
| Needs | a count column, a category (~6 values) |
|---|---|
| Optional | dates for trends, 11 more |
What is on it
- Access tickets by month Area chart
- Downtime by service Ranking chart
- Tickets by service Bar chart
- What the tickets are about Treemap
- Resolved against fixed on first contact Dumbbell chart
- Time to resolve by priority and service Heatmap