← All templates
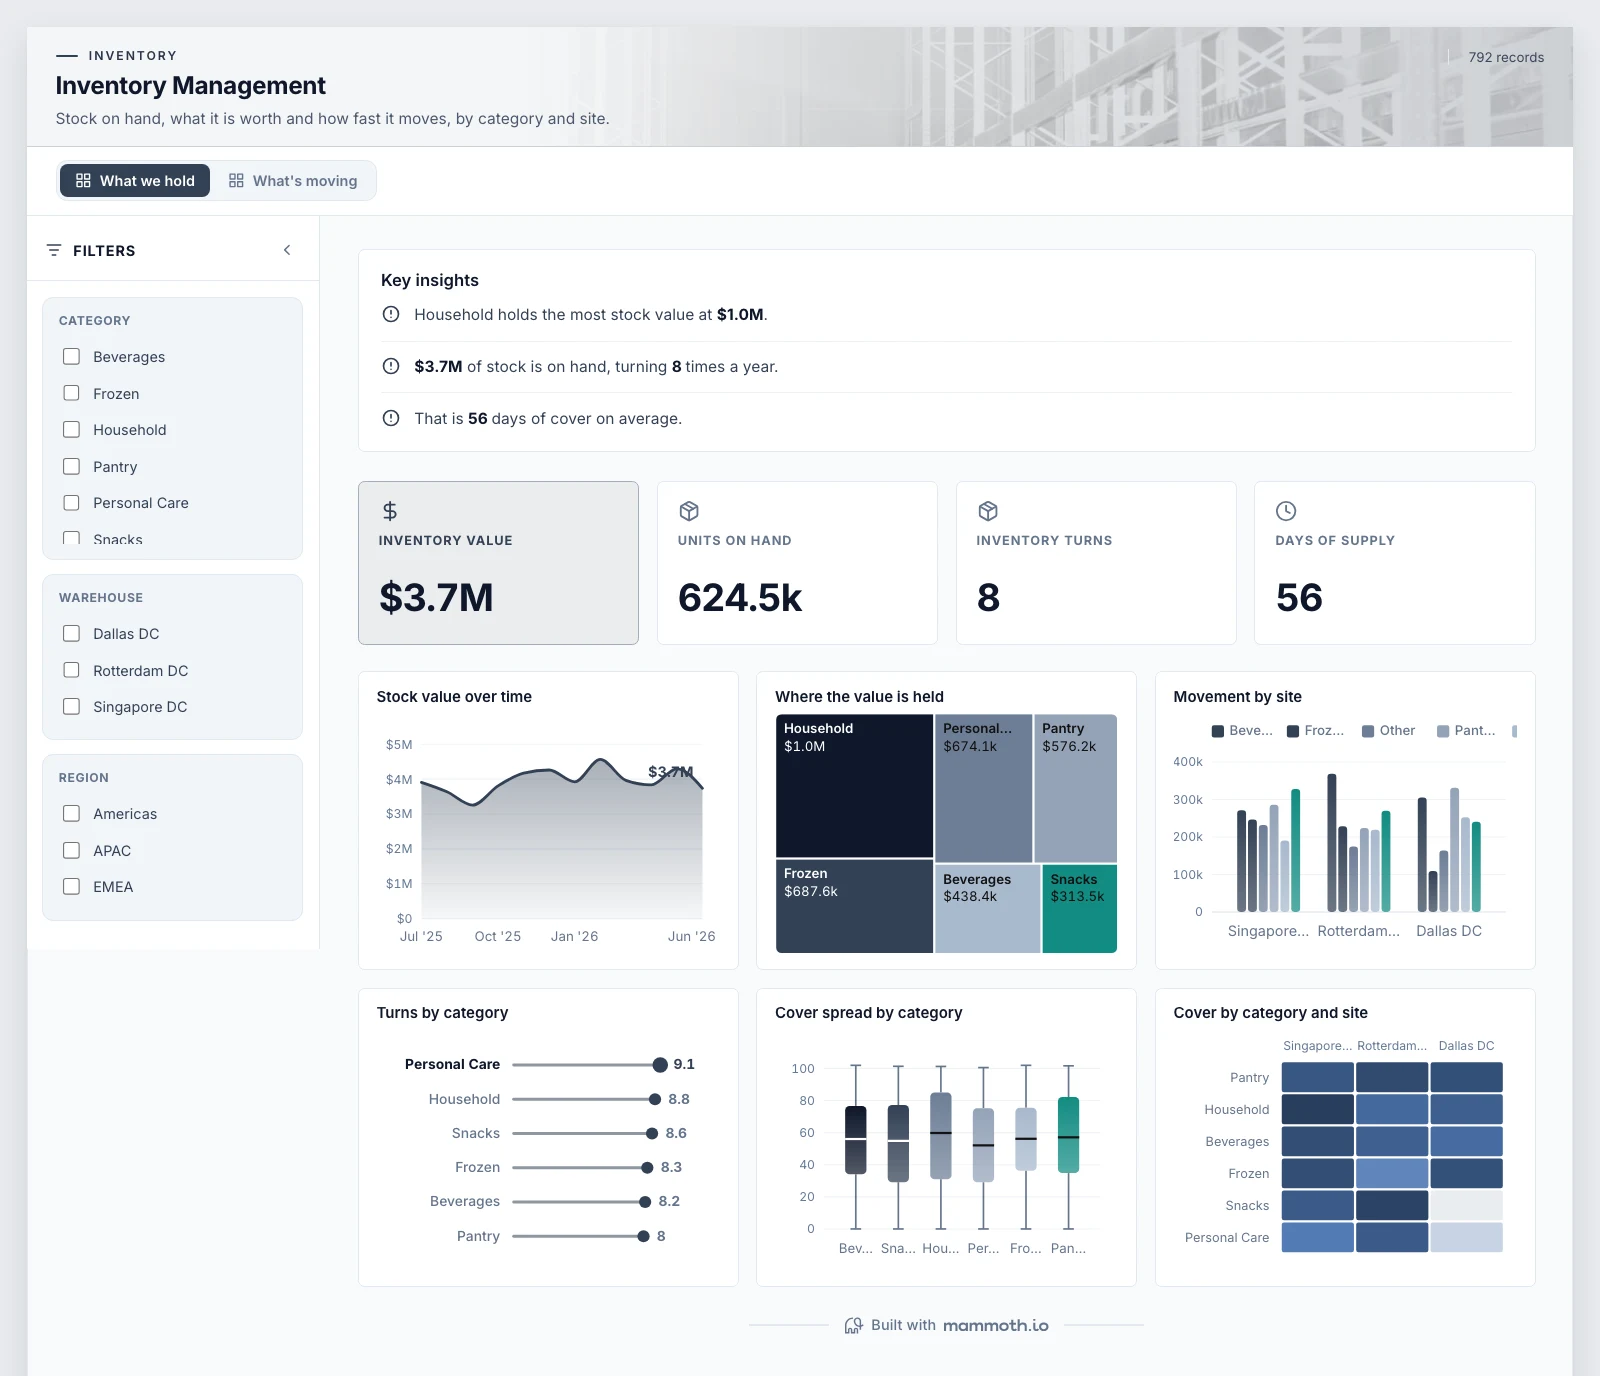
Shown on sample data. The figures are illustrative, not real business results — take the template and point it at your own.
Inventory Management
Stock on hand, what it is worth and how fast it moves, by category and site.
DashboardInventoryAny industryWhat it needs from your data
| Needs | a revenue or money column, a category (~6 values) |
|---|---|
| Optional | dates for trends, 8 more |
What is on it
What we hold shown above
- Stock value over time Area chart
- Where the value is held Treemap
- Movement by site Grouped bar chart
- Turns by category Ranking chart
- Cover spread by category Box plot
- Cover by category and site Heatmap
What's moving shown above
- Category ranking, month by month Bump chart
- Received against sold Combo chart
- Which lines hold the value Pareto chart
- Turns against cover Scatter plot
- Movement by site and region Grouped bar chart
- Intake by site Ranking chart