← All templates
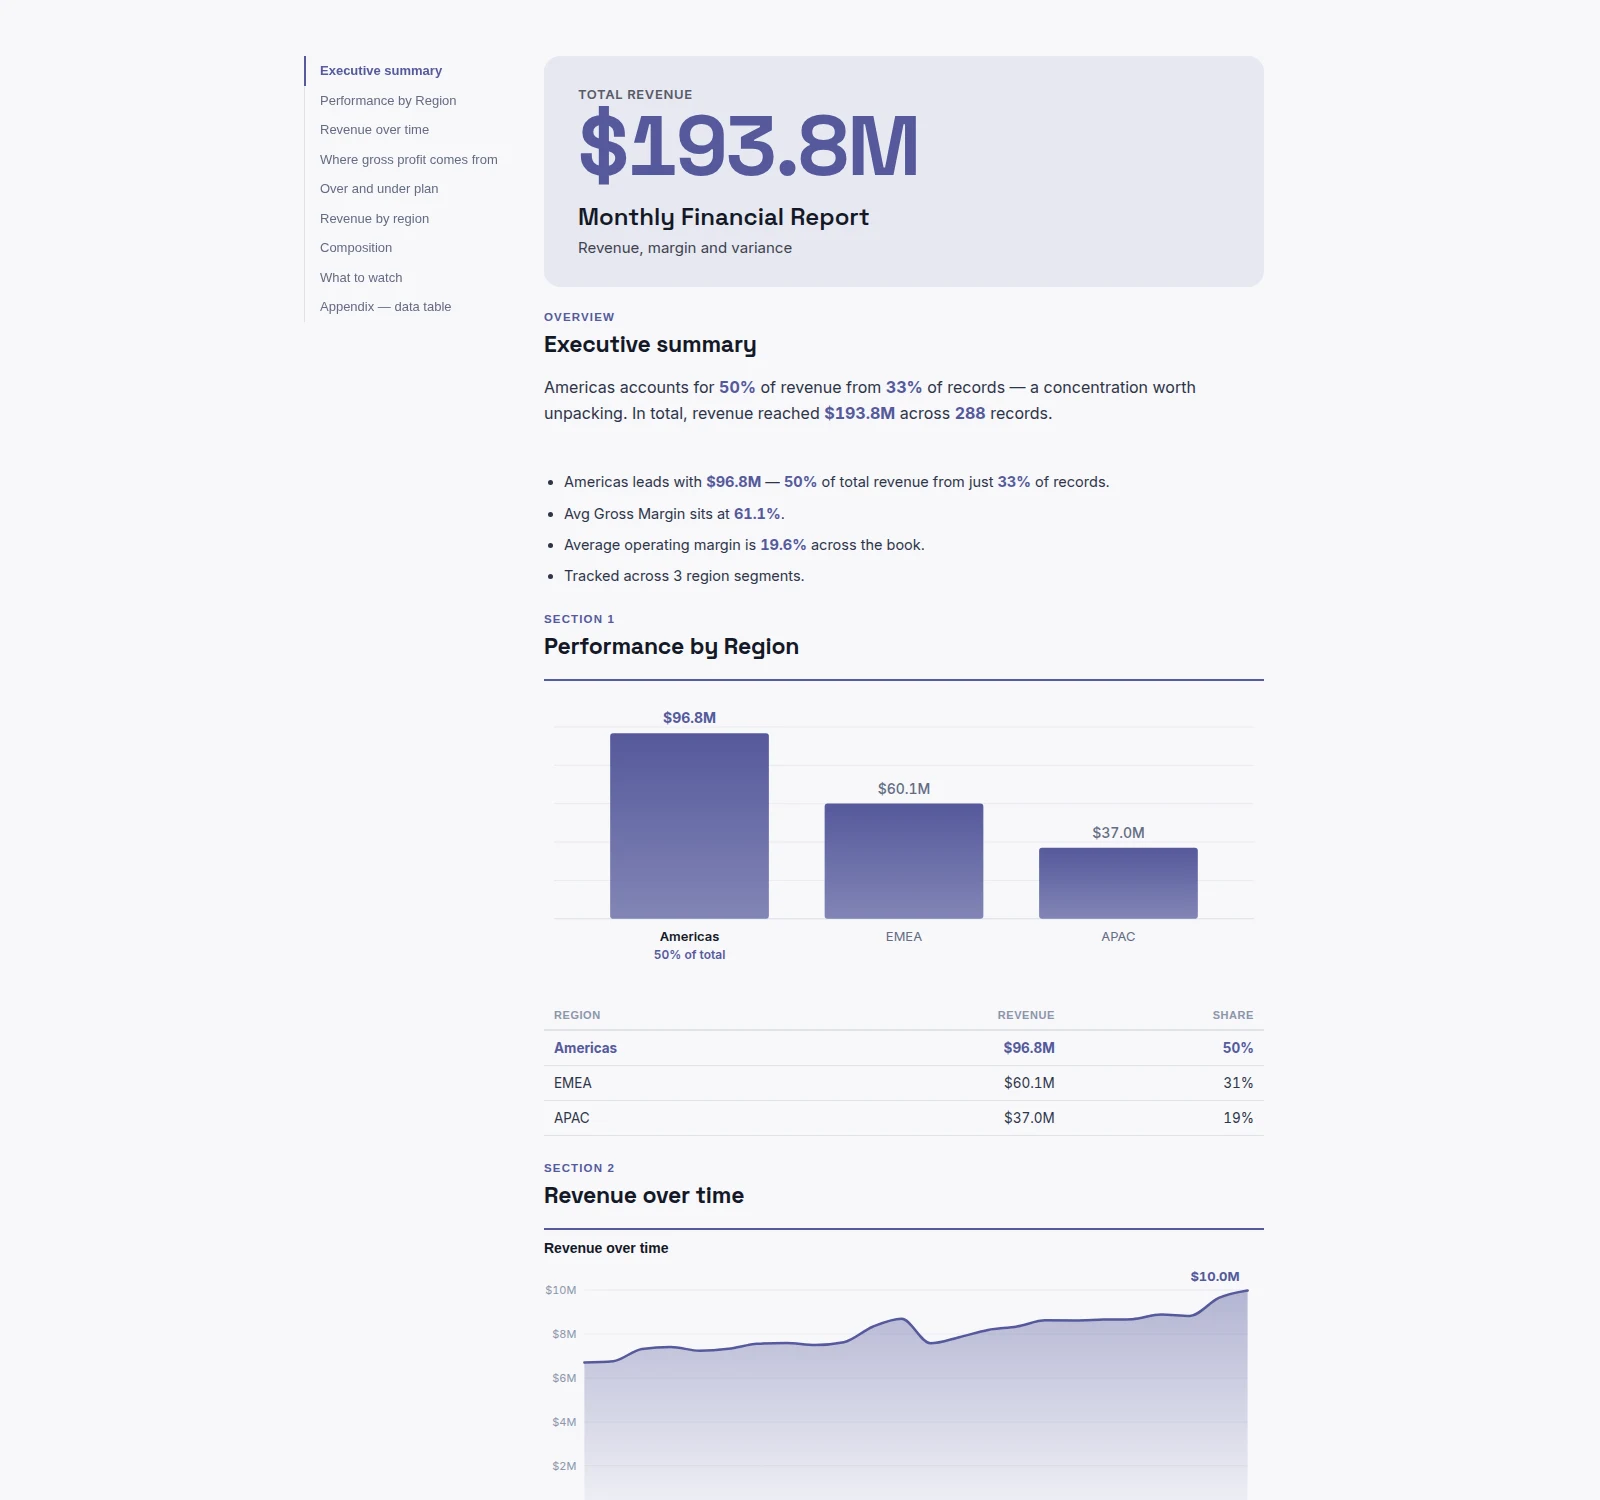
Shown on sample data. The figures are illustrative, not real business results — take the template and point it at your own.
Monthly Financial Report
The month written up: revenue, margin, variance to plan and what moved.
DocumentFinanceAny industryWhat it needs from your data
| Needs | a revenue or money column, a category (~4 values) |
|---|---|
| Optional | dates for trends, 8 more |
What is on it
- Revenue over time Area chart
- Where gross profit comes from Waterfall chart
- Over and under plan Diverging bar chart
- Variance by unit and region Heatmap
- Revenue by region Treemap
- Revenue against operating income Scatter plot