If you work with data, there’s a good chance you’ve come across Power Query and Power BI. Two of Microsoft’s most well-known tools for working with data.
But what’s the difference? And more importantly, which one should you actually use?
At Mammoth, we’ve spent a lot of time working with teams that rely on Power BI, and we’ve noticed a common frustration: Power Query can feel slow and clunky, and Power BI often struggles when working with big datasets.
That’s why we’re writing this.
We’re not here to tell you one tool is “better” than the other. We just want to break down their differences in plain English so you can decide what’s best for your workflow.
We’ll also share some insights from our experience helping companies simplify data transformation and reporting.
By the end, you’ll have a clear answer on whether you need Power Query, Power BI, or something else entirely. Let’s get into it.
What is Power Query?
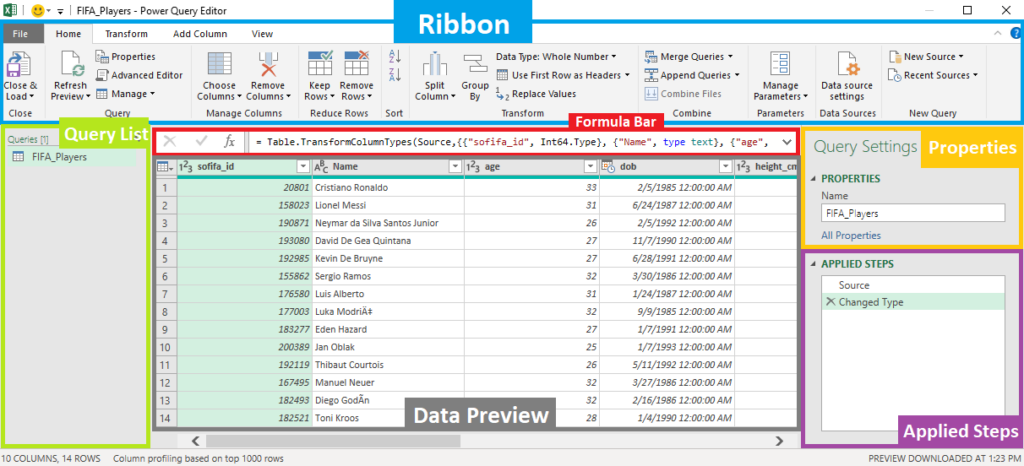
Power Query is Microsoft’s built-in tool for cleaning, shaping, and transforming data before you actually use it. Think of it like a prep station: it’s where you take messy, unstructured data and turn it into something usable before loading it into Excel or Power BI.
At first glance, it seems great. It’s built right into Excel and Power BI, and it gives you a simple way to combine multiple data sources, clean up columns, and automate repetitive tasks.
But here’s the thing: once you start working with more complex datasets, Power Query can feel frustratingly slow and limiting.
We’ve seen teams spend hours clicking through menus, applying transformations, and waiting for their data to refresh. Only to run into errors, long load times, or memory limits.
If you’re dealing with large datasets or need something more flexible, Power Query can quickly become a bottleneck.
That’s where tools like Mammoth come in. Instead of relying on Power Query’s rigid step-by-step approach, we make it easier to pull in, clean, and structure large datasets—without the headaches.
Now, let’s talk about Power BI and how it compares.
What is Power BI?
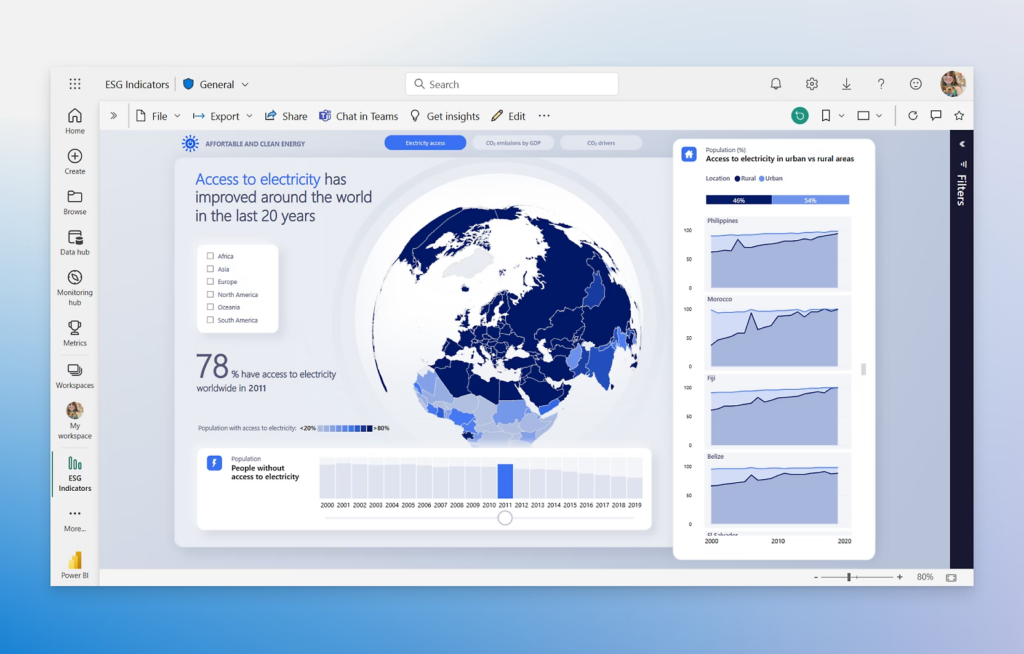
Power BI is Microsoft’s answer to business intelligence and data visualization.
If Power Query is the prep station, Power BI is where you actually see your data come to life: building dashboards, charts, and reports to help teams make sense of their numbers.
On paper, it also sounds like a dream tool. It connects to multiple data sources, has drag-and-drop visuals, and lets you create interactive reports without needing to code. But in reality? It’s not always as smooth as it sounds.
We’ve seen companies struggle with slow performance, complicated setup, and frustrating limitations when working with large datasets.
When your data isn’t already clean and structured the way Power BI wants it, you’re stuck going back to Power Query (or worse, Excel) to fix it. Adding extra steps and wasted time.
Another big issue? Handling large amounts of data. Power BI wasn’t built for big datasets, and if you’ve ever had a report take forever to load, or even just crash, you know what we’re talking about.
That’s why a lot of teams we work with end up looking for something faster and more flexible. Tired of wrestling with Power BI’s limitations? Mammoth gives you a better way to prep and transform your data before sending it to any BI tool. Without all the extra steps.
Now, let’s compare Power Query and Power BI side by side.
Power Query vs. Power BI: Feature Comparison
Now that we’ve covered the basics, let’s break it down side by side.
Power Query and Power BI often get lumped together, but they’re built for very different things. And when dealing with large datasets or complex transformations, Mammoth might be a better fit.
Here’s how they stack up:
Tool | Power Query | Power BI | Mammoth |
What It’s For | Cleaning and transforming data | Building dashboards and reports | Transforming, cleaning, and automating data for BI tools |
Ease of Use | Simple for small tasks, painful for big data | User-friendly but slows down with large datasets | Built for handling large data easily |
Works in Excel & Power BI | Works with multiple data sources | Works with any 100+ tools, including Power BI | |
Handling Large Data | Struggles with big datasets | Performance issues with large reports | Scales easily with large datasets |
Data Automation | Limited | Can refresh reports, but requires setup | Fully automated data pipelines |
Visualization | ❌ None | ✅ Full dashboard capabilities | ❌ No built-in dashboards, but preps data for any BI tool |
Best For | Basic data prep before analysis | Creating interactive reports | Automating complex data prep without Power Query’s headaches |
So Which One Should You Use?
- Use Power Query if you just need a quick way to clean small datasets inside Excel or Power BI.
- Use Power BI if you’re focused on reporting and dashboarding (but be ready for performance limits).
- Use Mammoth if you work with large datasets, need a data automation tool, or are frustrated with Power Query’s slow and manual process.
A lot of teams start with Power Query + Power BI and eventually hit roadblocks. Whether it’s slow load times, constant data errors, or the sheer pain of managing complex data transformations manually.
Sound familiar? It might be time to try a different approach (like Mammoth).
Next up, let’s talk about how to decide which tool makes the most sense for your workflow.
When to Use Power Query or Power BI
At this point, you probably have a pretty good idea of what each tool does. But let’s make it even simpler: when should you actually use Power Query, Power BI… or Mammoth?
Here’s how to decide:
Use Power Query if…
✅ You need to clean and reshape data inside Excel or Power BI.
✅ Your datasets are small to medium-sized and don’t require heavy processing.
✅ You’re okay with a manual, step-by-step approach to data transformation.
⚠️ Avoid Power Query if: Your datasets are large, your transformations are complex, or you’re tired of waiting for your queries to load.
Use Power BI if…
✅ You need dashboards, charts, and reports to visualize your data.
✅ Your data is already structured and doesn’t require much prep.
✅ You’re comfortable working within Microsoft’s ecosystem.
⚠️ Avoid Power BI if: Your reports run slow, your datasets are too large, or you need a lot of prep work before visualization.
Use Mammoth if…
✅ You need to clean, transform, and structure large datasets (without Power Query slowing you down).
✅ You want to automate data preparation instead of clicking through menus every time you need to update something.
✅ You’re using Power BI (or another BI tool) but struggling with slow performance or messy data.
⚠️ Avoid Mammoth if: You only work with small Excel files and don’t need automated data workflows.
So, Which One Is Right for You?
If you’re happy using Power Query and Power BI for simple reports, stick with them, they’re solid tools for basic data tasks.
But if you’ve hit a wall with Power Query, or your team spends more time fixing data than analyzing it, then it’s probably time to look at something built for bigger, faster, and more automated workflows. Like Mammoth.
Conclusion: Which One is Right for You?
Power Query and Power BI are solid tools. They’re built into Microsoft’s ecosystem, easy to pick up, and do the job for small to mid-sized datasets.
But if you’re here, chances are you’ve already run into the limits of Power Query or Power BI. Maybe your data is getting too big, your reports are slowing down, or you’re just tired of clicking through menus every time you need to update something.
That’s exactly why we built Mammoth. To take the frustration out of cleaning and transforming data, especially at scale.
So here’s the simple takeaway:
- Power Query = Fine for small, manual data cleaning.
- Power BI = Great for dashboards, but slow with complex data.
- Mammoth = Built for large, automated, and scalable data transformation.
Still manually wrangling data in Power Query or waiting forever for Power BI reports to load? Why not try something better?
👉 Try Mammoth for free and see how much faster data prep can be.