Or skip the templates entirely & create dashboards in 15 minutes with AI.
If you’re wasting hours choosing the right color combinations and charts for your reports, Power BI templates can help. But here’s what most teams discover: Power BI templates still require weeks of training and days of manual work.
What if you could skip Power BI entirely? Mammoth creates professional dashboards in 15 minutes using conversational AI. No training. No templates. Just describe what you want to see.
What are Power BI templates?
Power BI templates help you jump-start the dashboard design process. But templates don’t solve the real problem: Power BI requires weeks of training before you can use any template effectively.
The modern alternative: AI-powered dashboard creation. You describe what you want (“Show me revenue by region with monthly trends”), AI generates a professional dashboard in minutes. Zero training required.
That said, if you’re committed to Power BI, these template examples can provide design inspiration. We’ve categorized them by industry, department, and use case.
Power BI Templates: By Industry
Power BI templates for Financial services
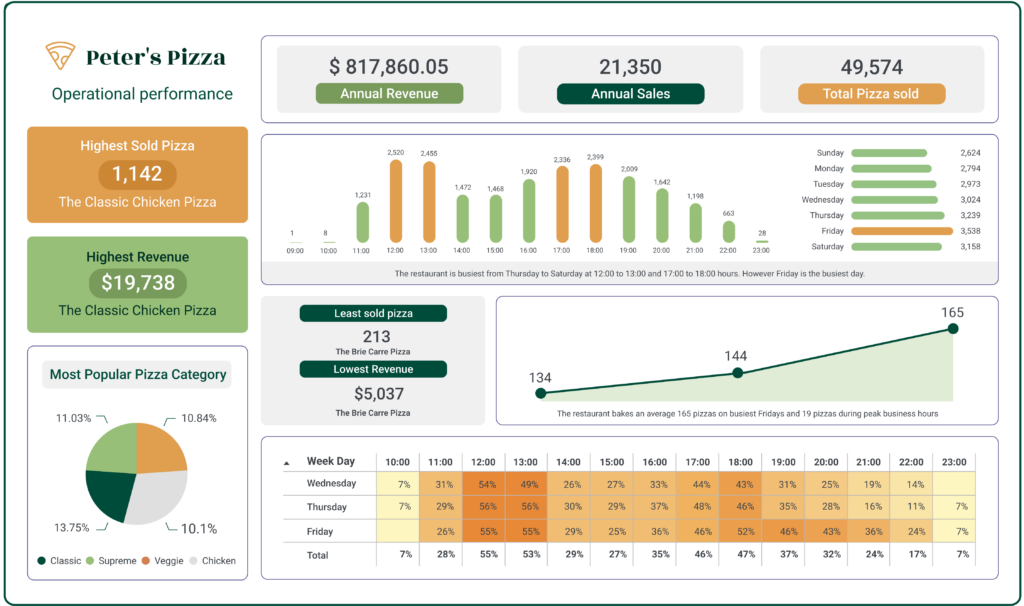
Financial dashboards show a company’s financial position—P&L reports, revenue/budget reports, expense reports, and related metrics.
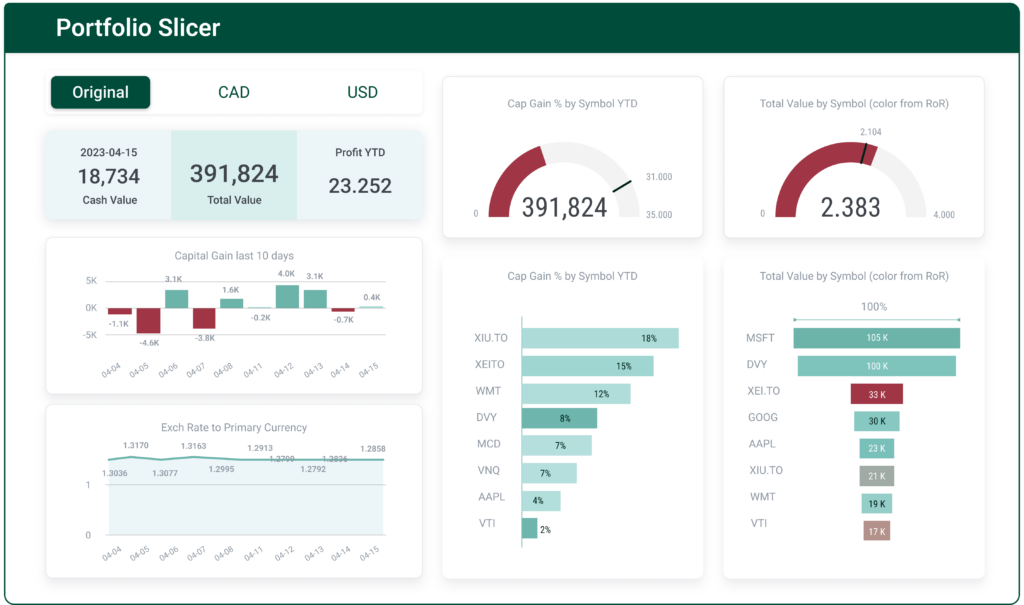
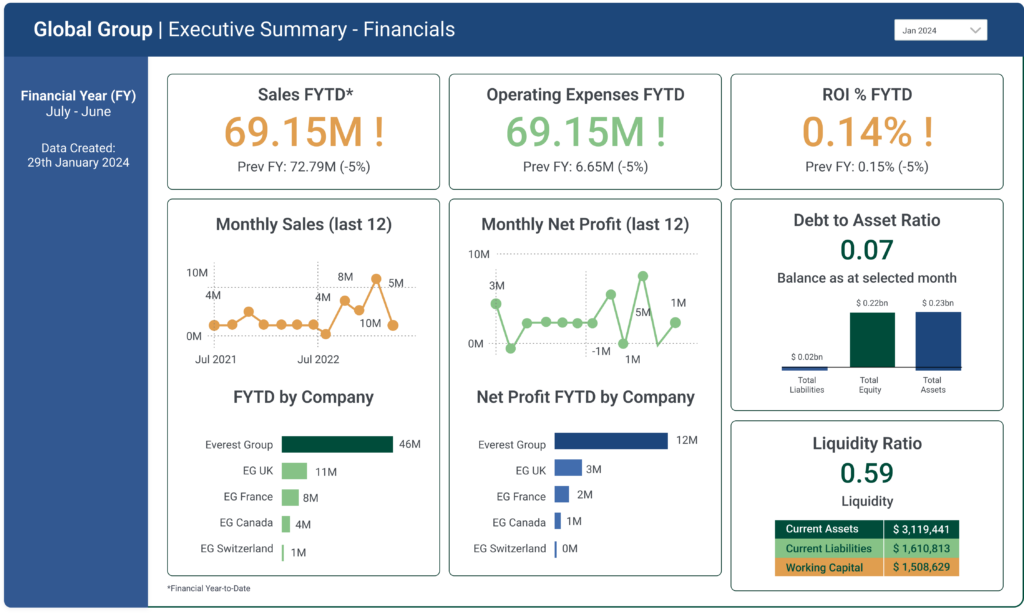
Tips to create an effective financial Power BI dashboard:
- Functionality: Identify the key KPIs. Present what matters the most.
- User-friendliness: Avoid using 20 different reports. Use 5 instead. Add drill-downs if needed.
- Context: Provide context where possible. Define metrics clearly.
- Design: Avoid loud and contrasting colours. Let the data tell the story.
Charts to use:
- KPI Indicators: Profit margins, ROI, liquidity ratios
- Line Charts: Revenue, expenses, or profit margins over time
- Column and Bar Charts: Monthly revenues, expenses, or budget comparisons
- Pie Charts: Distribution of expenses or revenue by category
- Tables: Detailed data and granular information
The Power BI reality: Even with this template, you’ll spend 3 weeks learning Power BI, then 2-3 days building the dashboard, then more time maintaining it.
The Mammoth alternative: “Create a financial dashboard showing P&L, revenue trends, and expense breakdowns by department.” AI generates it in 15 minutes. Beta user quote: “The speed of insights is impressive as is the visualization.”
See how Mammoth creates dashboards →
Power BI templates for CPG
Consumer Packaged Goods dashboards represent sales and inventory reports, market trends, and supply chain monitoring.
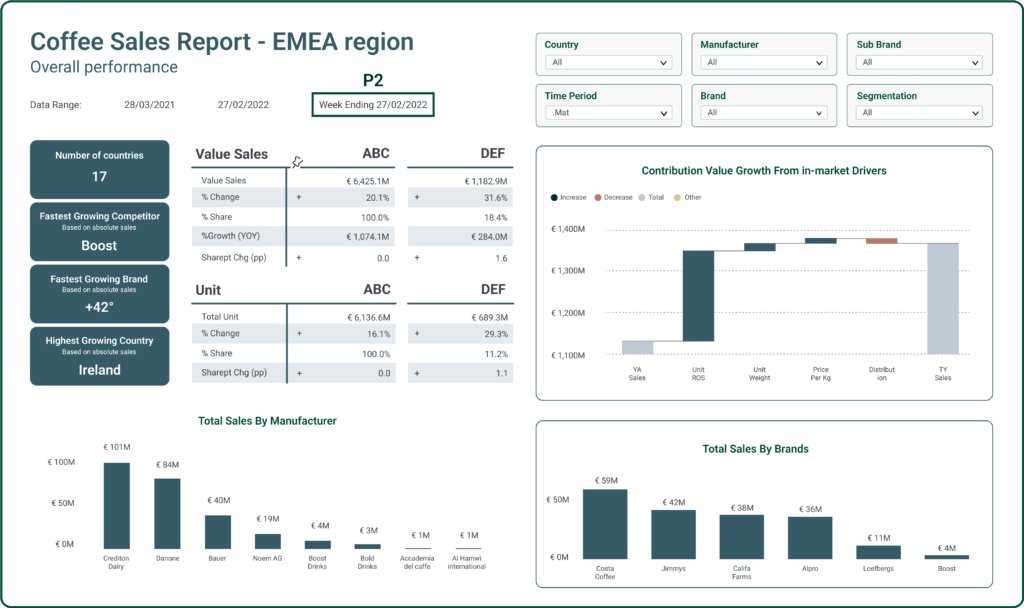
Tips to create an effective CPG dashboard:
- Relevance to Stakeholders: Tailor to business needs
- Interactivity: Use filters and drill-downs
- Visual Consistency: Maintain color schemes and branding
Charts to use:
- KPI indicators: Key business performance metrics
- Line Charts: Sales and revenue trends
- Area Charts: Product category contributions
- Stacked Bar Charts: Inventory distribution
- Map Visualizations: Supply chain geography
Why companies skip Power BI for CPG dashboards: RethinkFirst reduced dashboard creation from 30 hours to 4 hours by using AI instead of Power BI templates. The time savings came from eliminating the manual template customization work.
Power BI templates for Healthcare
Healthcare dashboards provide patient care data, clinical research, operational efficiency, and resource allocation insights. These must be HIPAA-compliant.
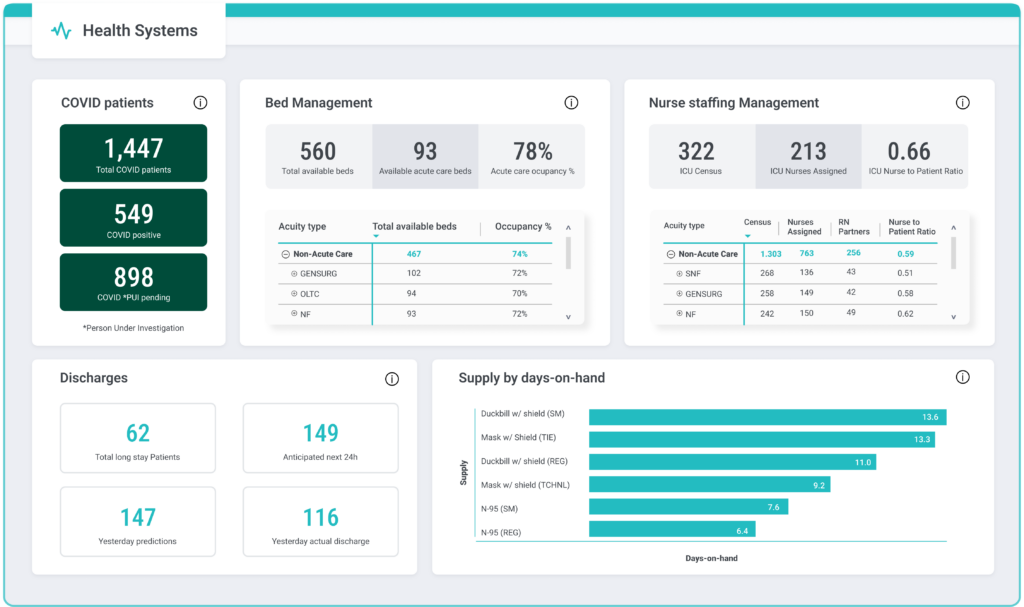
Tips to create an effective Healthcare dashboard:
- User-Friendly Design: Intuitive navigation for healthcare professionals
- Security and Compliance: HIPAA compliance is non-negotiable
- Predictive Analytics: Forecast trends and patient outcomes
- Performance Monitoring: Hospital operations and resource utilization
- EHR Integration: Seamless patient data flow
Charts to use:
- Line Charts: Patient admissions, discharge rates, bed occupancy trends
- Bar Charts: Metrics by department or diagnosis
- Pie Charts: Patient type distribution (inpatient, outpatient)
- KPI Indicators: Patient satisfaction, compliance rates
- Heat Maps: Performance variations across dimensions
Compliance note: Mammoth provides SOC 2 Type II, ISO 27001, and HIPAA-ready architecture—meeting the same compliance standards as Power BI, but with zero training required.
Stop spending weeks learning Power BI
Power BI requires: 3 weeks of training + 2-3 days per dashboard
Mammoth requires: Zero training + 15 minutes per dashboard
Create professional dashboards by describing what you want. AI handles the rest.
Beta-validated results:
- “Very cool. The speed of insights is impressive as is the visualization.” (User with Tableau experience)
- “Very impressive, thanks!” (User without prior BI experience)
- Average time: 12-18 minutes from idea to shareable dashboard
- 90% time reduction vs. traditional BI workflows validated
- 9.2/10 beta user satisfaction score
Try Mammoth Free | Book a Demo
PowerBI Templates by Department
Power BI templates for Marketing
Marketing dashboards consolidate PPC, SEO, Content, and Social Media KPIs.

Tips to create an effective Marketing dashboard:
- Key KPI Measurement: Conversion rates, CTR, ROI, customer segmentation
- Variety: Mix different chart types for visual interest
- Context and Story: Connect different functions into a cohesive narrative
Charts to use:
- Line charts: Website traffic, leads, sales trends
- Segmentation Charts: Customer demographics and behavior
- Funnel Charts: Customer journey tracking
- Stacked Column Charts: Promotional impact by category
- Heat Maps: Product relationships and co-purchases
The marketing challenge: By the time you manually consolidate data from Google Analytics, Facebook Ads, and Salesforce into Power BI, your CMO is looking at week-old data. Real-time insights require faster tools.
Modern solution: Connect all your marketing sources to Mammoth. Create dashboards conversationally: “Show me campaign performance by channel with cost per acquisition.” Updates automatically.
Power BI templates for Sales
Sales dashboards show gross sales, gross margin, revenue, customer interactions, and pipeline status.

Tips to create an effective Sales dashboard:
- Sales Pipeline Analysis: Visualize stages, conversion rates, bottlenecks
- Revenue Forecasting: Historical data and market trend analysis
- CRM Integration: Track customer interactions and lead conversion
Charts to use:
- Line Charts: Sales trends over time
- Bar Charts: Comparisons by products, regions, channels
- Funnel Charts: Sales process stages and conversion
- KPI Indicators: Key performance metrics
- Map Visualizations: Geographic sales distribution
Why sales teams choose Mammoth: When a prospect asks “Can you show me our pipeline dashboard for tomorrow’s call?”—you need dashboards in 30 minutes, not 3 days. Non-technical sales ops teams create dashboards independently with Mammoth.
Power BI templates for Operations
Operations dashboards monitor cycle time, throughput, capacity utilization, inventory levels, production yield, downtime, and efficiency metrics.
Tips to create an effective Operations dashboard:
- Supply Chain Analytics: Monitor procurement to distribution
- Quality Control: Track defects and quality metrics
- Resource Utilization: Analyze efficiency and costs
Charts to use:
- Gantt Charts: Task timelines and durations
- Stacked Bar Charts: Resource and workload distribution
- KPI Indicators: Performance at a glance
- Pie Charts: Component breakdowns
- Heat Maps: Data variations and concentrations
Real-time operations: Manufacturing can’t wait for yesterday’s data. When quality issues emerge, operations managers need dashboards showing defect rates by line—now. Not after a 2-day Power BI development cycle.
Power BI templates for HR
HR dashboards track employee engagement, performance, recruitment, satisfaction, hirings, attrition, compensation, and departmental costs.
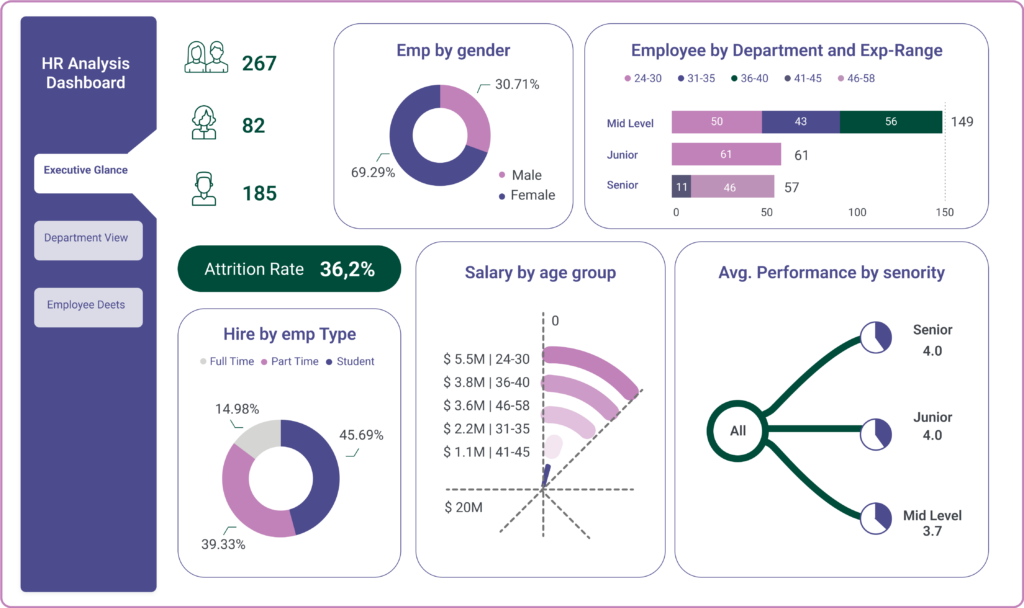
Tips to create an effective HR dashboard:
- Workforce Analytics: Turnover, performance, satisfaction metrics
- Recruitment and Onboarding: Time-to-hire and program effectiveness
- Employee Engagement: Survey results and feedback visualization
Charts to use:
- Stacked Bar Charts: Workforce demographics
- Line Charts: Turnover rates, headcount trends
- Donut Charts: Employee composition breakdowns
- Treemap Charts: Organizational hierarchies
- Heat Maps: Performance ratings and engagement
Power BI Templates by Use cases
Power BI templates for Google Ads Data
Google Ads dashboards consolidate clicks, impressions, conversions, and campaign performance metrics.
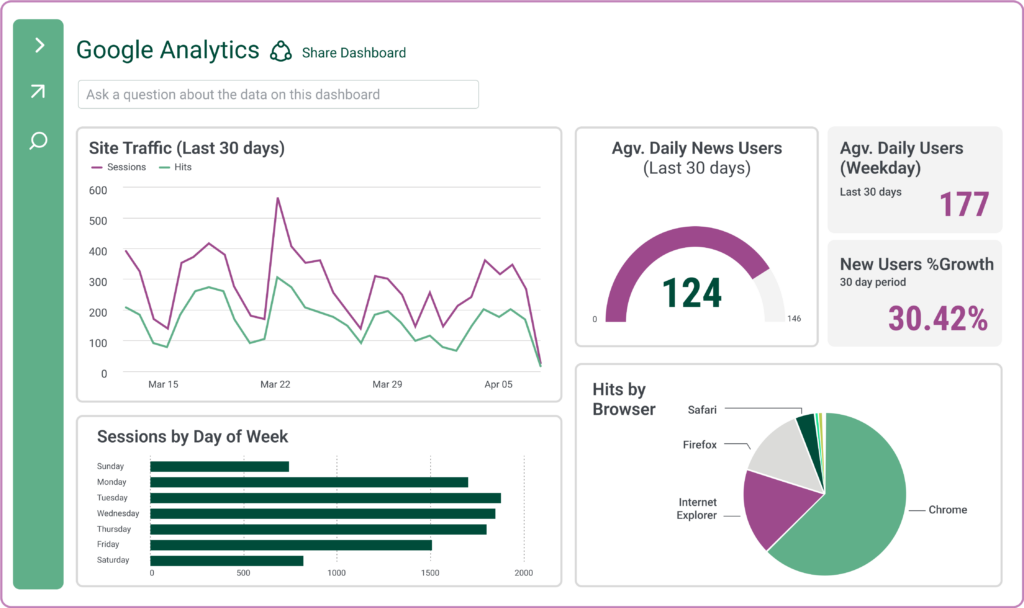
Tips to create an effective GAds dashboard:
- Focus on KPIs: CTR, Conversion Rate, CPC, ROAS
- Segmentation: Break down by campaigns, ad groups, keywords
- Time-Based Analysis: Trends, patterns, optimization insights
- Interactive Elements: Drill-downs, filters, slicers
Charts to use:
- KPI Indicators: Scorecards, data cards, gauges
- Line Charts: KPI trends over time
- Bar Charts: Campaign performance comparisons
- Pie Charts: Budget allocation proportions
- Scatter Plots: Metric correlations (CTR vs. CPC)
Power BI dashboard for Facebook Page Data
Facebook Ads dashboards visualize reach, engagement, click-through rates, cost per click, and campaign effectiveness.
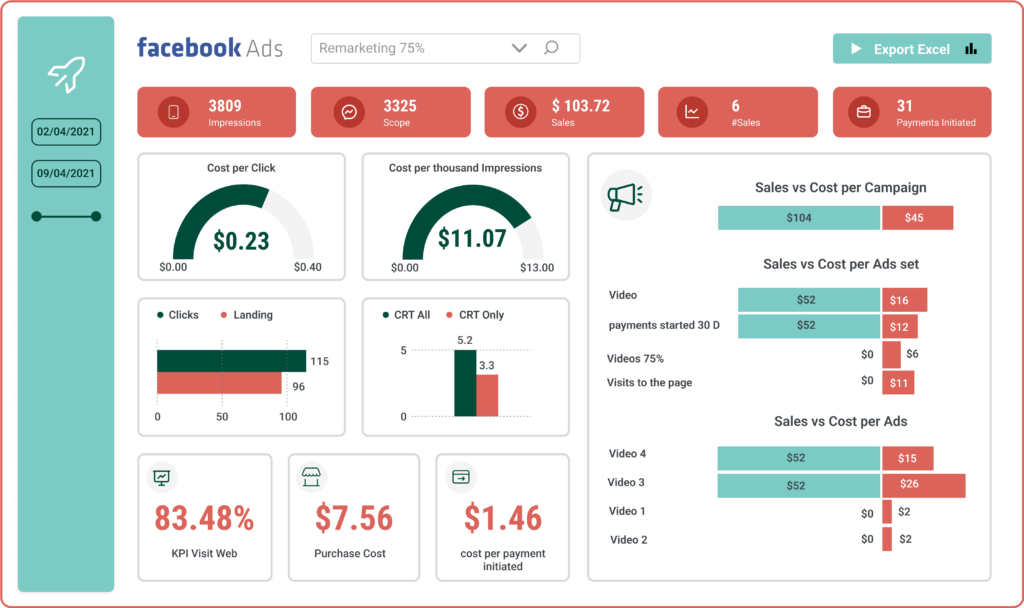
Tips to create an effective Facebook Ads dashboard:
- Ad Performance Metrics: CTR, conversion rates, CPC tracking
- Audience Insights: Demographics, interests, behaviors
- Ad Spend and Budget: Utilization and ROAS monitoring
- A/B Testing: Compare variations for optimization
Charts to use:
- Line Charts: KPI trends
- Bar Charts: Campaign comparisons
- Pie Charts: Budget allocation
- Scatter Plots: Metric correlations
- KPI Indicators: Performance gauges and scorecards
The Power BI template reality check
You’ve seen 9 beautiful Power BI templates. Here’s what happens next if you choose Power BI:
Week 1-3: Power BI training certification ($3K-5K per person + 3 weeks productivity)
Week 4: Start building your first dashboard with a template
Days 1-2: Connect data sources, clean data, prepare structures
Day 3: Customize template, configure filters, test interactivity
Ongoing: Maintain dashboards, train new team members, repeat process
Total time to first dashboard: 3+ weeks
Total cost per person: $4K-7K + lost productivity
Scalability: Limited to people who complete training
Or skip Power BI entirely
Mammoth’s AI dashboard creation (launching soon):
Minute 1: Connect your data sources (100+ connectors)
Minutes 5-15: Describe what you want via conversational prompts Minutes 12-18: Professional dashboard complete (average beta time)
Training required: Zero
People who can do this: Everyone on your team
Beta-validated quotes:
- “Very cool. The speed of insights is impressive as is the visualization.” (User with Tableau/Power BI experience)
- “Very impressive, thanks!” (User without prior BI tool experience)
Key metrics from beta:
- Average dashboard creation: 12-18 minutes
- User satisfaction: 9.2/10
- 90% time reduction vs. traditional BI workflows
- 95% achieve desired result in 1-3 conversational iterations
Power BI Templates: Conclusion
We’ve explored nine Power BI templates across industries, departments, and use cases. These templates showcase excellent design principles for financial, CPG, healthcare, marketing, sales, operations, HR, and advertising dashboards.
If you’re committed to Power BI: These templates provide valuable design inspiration. Remember you’ll need to invest in training and dedicate significant time to customization.
If you want dashboards without the complexity: Mammoth offers a fundamentally different approach. No templates needed. No training required. No weeks of waiting. Just conversational dashboard creation that works for everyone on your team.
The decision:
- Choose Power BI if: You need advanced analytics workspaces, have dedicated BI experts, can invest 3+ weeks in training
- Choose Mammoth if: You need professional dashboards quickly, want zero training requirements, need everyone on your team capable of creating dashboards
Create your first dashboard in 15 minutes
AI-powered dashboard creation (currently in beta, launching soon). Zero Power BI training required. Zero templates needed.
Simply describe what you want to see:
- “Show me revenue by region with monthly trends”
- “Track customer satisfaction scores by product line”
- “Display inventory levels with reorder point indicators”
- “Visualize marketing campaign performance by channel”
AI generates professional dashboards instantly. Customize through conversation. Share with anyone.
What you get:
- AI-powered dashboard creation (conversational prompts)
- 100+ data source connectors
- Professional industry-specific themes
- Public, password-protected, and authenticated sharing
- SOC 2 Type II & ISO 27001 certified
- 21-day free trial
Beta-validated: Users create dashboards in 12-18 minutes on average, with 9.2/10 satisfaction scores. Works for both technical and non-technical users.
No credit card required. See results today.
Try Mammoth 7-Days Free
Create dashboards with AI, no code required.
Professional dashboards in 15 minutes through conversational prompts. No Power BI training needed. 21-day free trial.