In a utopian world, data cleaning in excel wouldn’t be needed. You sheets would always be clean and properly formatted.
But in reality, data is riddled with formatting issues, duplicate rows, missing values, spelling mistakes, improper capitalizations, lack of structure, and so much more.
Struggling with messy data in Excel? Fix it with Mammoth!
Join thousands of data pros who streamline their workflow with Mammoth. Start your free trial today and see how Mammoth simplifies your data prep.
If you’re a professional still looking to skip past the repetitive process of data cleaning to more meaningful work, stick around to learn how to clean your data in two ways:
- Manually in Excel (best suitable for one-off tasks)
- Automatically in Mammoth (most suitable for continuous data management).
Here are the 8 most common data cleaning in Excel tasks:
- Remove duplicates
- Standardize formats
- Even out casing and remove extra spaces
- Split delimited data
- Find and replace
- Extract prefixes and suffixes
- Check for spelling and typos
- Fill missing values
The Hidden Cost of Repetitive Data Cleaning
Before diving into the techniques, consider this: if you’re cleaning data manually in Excel every week, you’re likely spending 10-15 hours per month on repetitive tasks.
That’s 120-180 hours per year. Time that could be spent on analysis, strategic projects, or building insights that actually drive decisions.
Analysts commonly tell us:
- “We spend way too much time on data prep”
- “80% of my time is just cleaning data”
- “Manual Excel processes are killing us”
The question isn’t whether these tasks need to be done – it’s whether you want to repeat them every week or automate them once.
Calculate your time savings with Mammoth →
1. Remove duplicates {#duplicates}
Before you go ahead with any cleaning, you should understand the origins of your data. How it was recorded, where & how it is stored, how it is imported, etc.
Often, different bits of data are stored as different datasets, and in different databases. When you bring together this data, you might see duplicated rows.
Once you have an understanding of the origins of the data and the duplication, this is how you can remove it:
In Excel
To remove duplicates in Excel,
- Select a column or range
- Go to the “Remove duplicates” tool under the Data option and you’ll see a modal like this one:
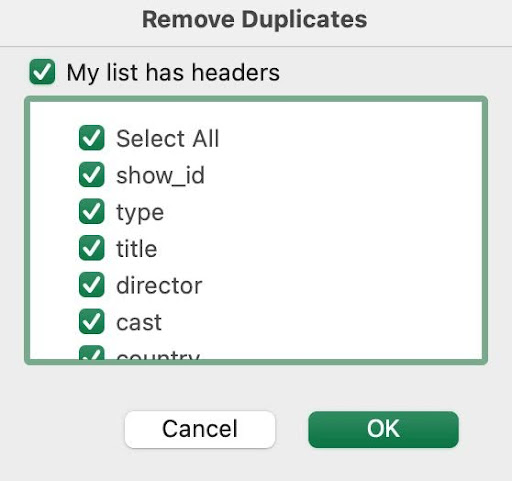
- Select the columns you want to remove duplicates from and check the headers box if your dataset has headers
- Click OK.
While this looks straightforward, it gets repetitive with every data pull. Here’s how to do it once and get automated data cleaning for Excel files.
In Mammoth
To remove duplicates in Mammoth,
- Go to the Transform menu,
- Select the Remove duplicate rows function under Reshape, Group and Aggregate
Remove Duplicates function in Mammoth
- Ignore columns if you want to, otherwise apply the rule on the whole dataset
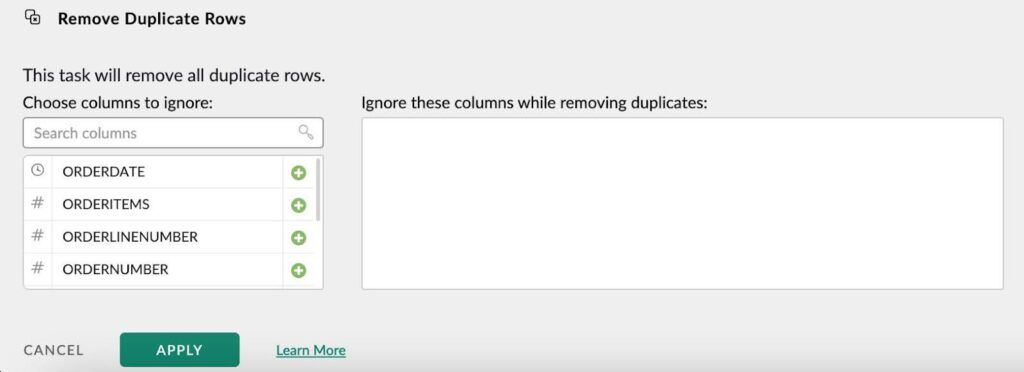
- Click Apply.
The task gets recorded in the pipeline and runs every time there is new data inflow in the dataset, not requiring additional effort from your end.
Real-world example: Starbucks processes over 1 billion rows of multi-country sales data monthly. Before Mammoth, their team spent 100+ hours on manual data consolidation each month. With Mammoth’s automated pipelines, this now runs with zero manual hours.
See how Mammoth automates duplicate removal →
2. Standardize formats {#standardize}
One of my most common challenges with data cleaning is fixing format and structure.
While most databases contain structured data, there are times when formats are wrongly detected, or there are mismatches in data formats from two complementary datasets.
Detecting and assigning the correct data type and format is crucial to performing the right calculations. Incorrect data types can even restrict you from performing datatype-specific functions.
For example, if your numeric data is formatted as text, you’ll not be able to perform arithmetic functions on them. Or if a date column is formatted as dd-mm-yy in one dataset, and as a time stamp dd-mm-yy hh:mi:ss in another, there will be a mismatch.
In Excel
In Excel, you can use Power Query to detect and change the data type and formats.
Here’s how,
- Go to Power Query
- Select a data source. It will automatically detect data types based on the column values
- Go to the Query > Edit
- Select a column, and then select Transform > Detect Data Type
- Choose a data type/format from the drop-down.
Alternatively, you can use the Text to Column function in Excel to change the data types & formats.
This is how,
- Select a cell or column
- Right-click on the cell or column and select Format Cells from the menu. Alternatively, press ctrl+1 in Windows or Command+1 in Mac to open the Format widget
- Change the data type or the format of the column
- Click OK.
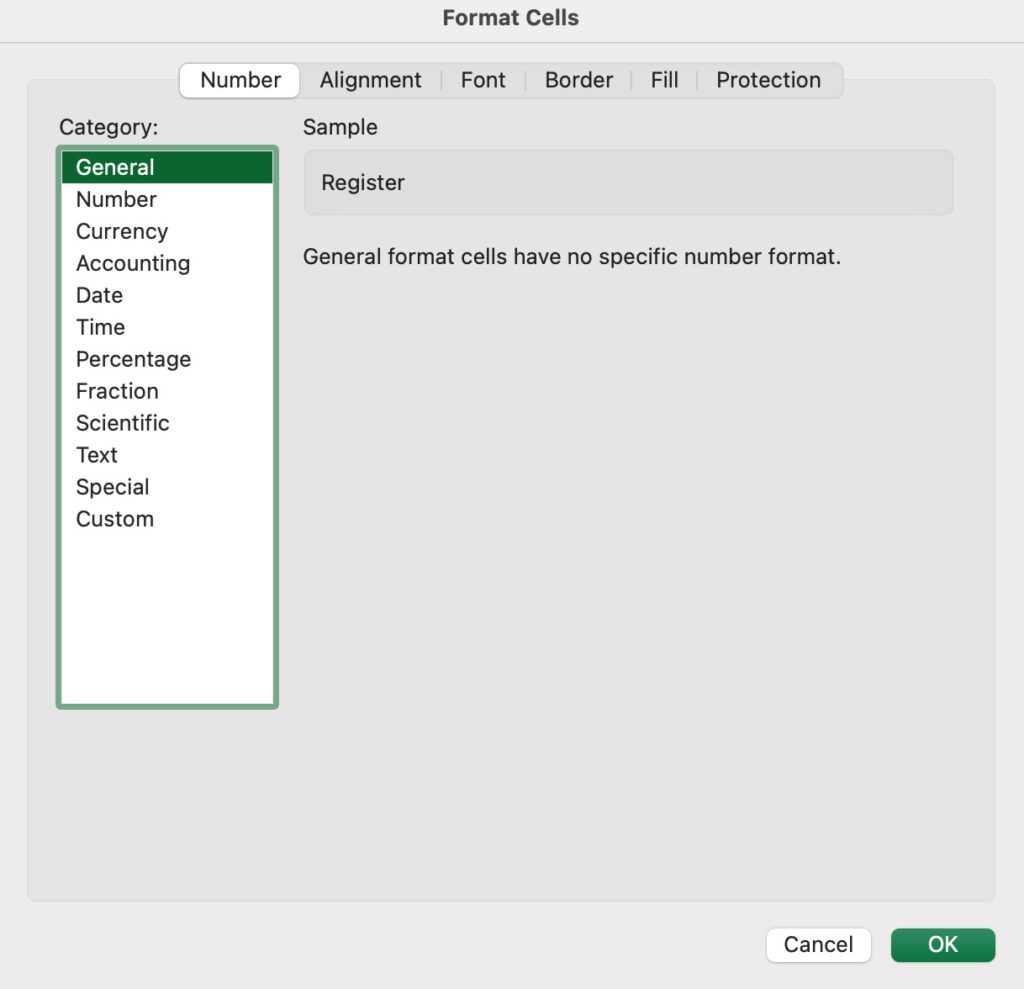
Format Cells wizard in Excel
Changing data types in Excel is a lot of work especially when you want to change data types of multiple columns at a time.
In Mammoth
You can change data types of multiple columns at once,
- Select a single column or select multiple columns from the column browser
- Choose the Convert data type function
- Select datatypes for the columns
- And apply all at once.
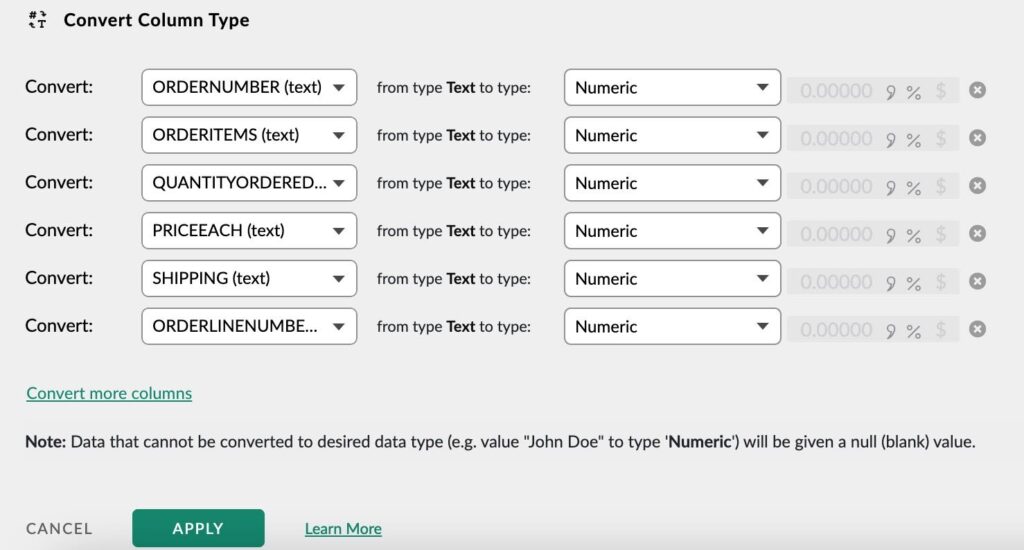
This task also gets added to the pipeline and runs automatically on data updates.
Try automated format standardization →
Excel vs. Mammoth: Time Comparison
Task | Manual Excel (Weekly) | Mammoth Setup | Ongoing Time |
|---|---|---|---|
Remove Duplicates | 10 min | 2 min once | 0 min |
Standardize Formats | 20 min | 5 min once | 0 min |
Fix Casing/Spaces | 15 min | 3 min once | 0 min |
Split Columns | 15 min | 3 min once | 0 min |
Find & Replace | 25 min | 5 min once | 0 min |
Extract Text | 10 min | 2 min once | 0 min |
Fill Missing Values | 15 min | 3 min once | 0 min |
Total per week | 110 min | 23 min once | 0 min |
Total per year | 95+ hours | 23 min | 0 hours |
That’s 95 hours of your life every year spent on repetitive tasks.
See how Mammoth customers save time →
3. Even out casing and remove extra spaces {#casing}
Casing and extra spaces in text columns are again basic formatting issues analysts regularly come across. Having consistent formatting across your datasets prevents erroneous calculations or blank cells.
In Excel
Fixing casing in Excel is quite a manual process,
Here’s how you can do it,
- Insert a new column (Say col B) next to the text column
- In the new column, write the formula – =UPPER(cell address) – Converts to UPPERCASE
=LOWER(cell address) – Converts to lowercase
=PROPER(cell address) – Converts to Proper Case - Drag to apply to all the cells in the column
- Copy the values in col B and Paste the values (without the formula) in the text column.
- Now, delete column B.
Removing extra spaces can be a task of its own in Excel. The TRIM function in Excel removes all leading, trailing, and extra spaces barring one space between words.
Here’s how you can use it,
- Insert a new column (say col B) next to the text column you want to trim
- Write the formula – TRIM(cell address) in the new column
- Drag to all the cell
- Copy the values from col B and paste them into the text column. All extra spaces will be removed.
In Mammoth
To fix casing or extra spaces in Mammoth, you don’t need to use separate functions. Just use the Text formatting function and fix everything in one go, like this –
- Go to the Transform menu
- Find the Text formatting under Text functions
- Change the casing of text functions and normalize spacing
- Click Apply.
In Mammoth, you apply the rule once and it gets automated forever. On new data pulls, the data goes through the same data-cleaning steps automatically. You are not required to clean new data again and again.
Automate text formatting in Mammoth →
4. Split delimited data {#split}
Many times a few columns contain a lot of information delimited by a comma or space. You might need to split them into multiple columns for data processing. This process is also called Data Parsing.
In Excel
Parsing data in Excel goes like this,
- Select the cell or column that contains the text you want to split.
- Select Data > Text to Columns.
- In the Convert Text to Columns Wizard, select Delimited > Next.
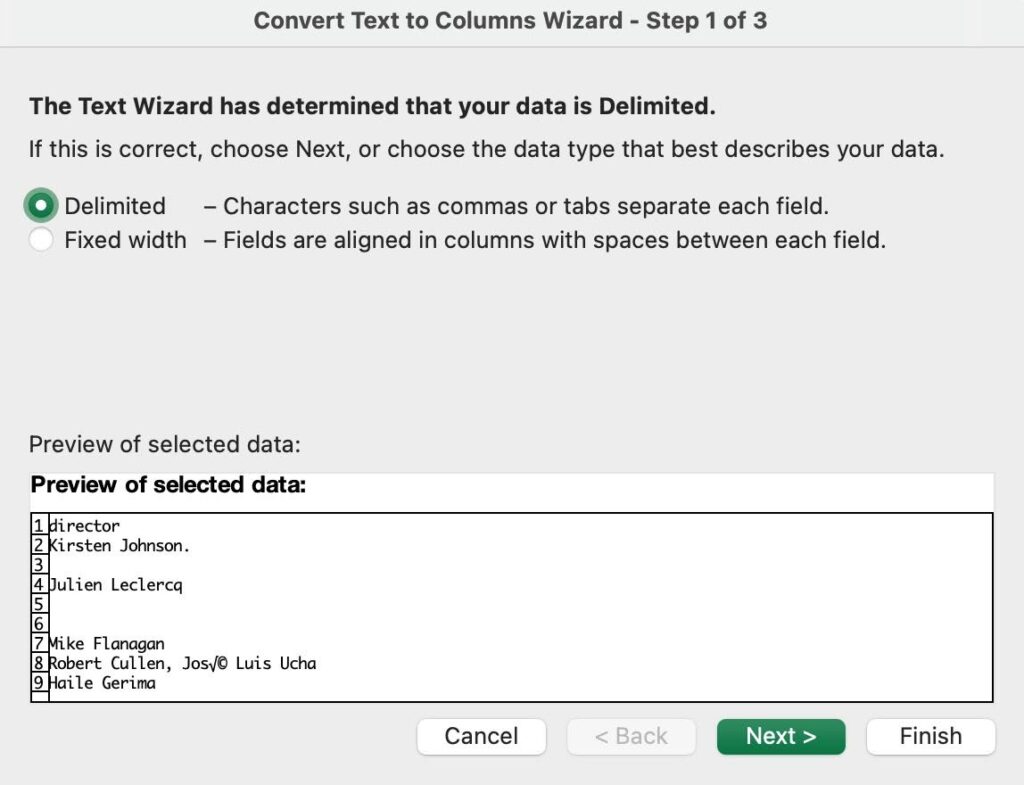
- Select the Delimiters for your data. For example, Comma, Space, Semicolon, or Tab. You can see a preview of your data in the Data preview window.
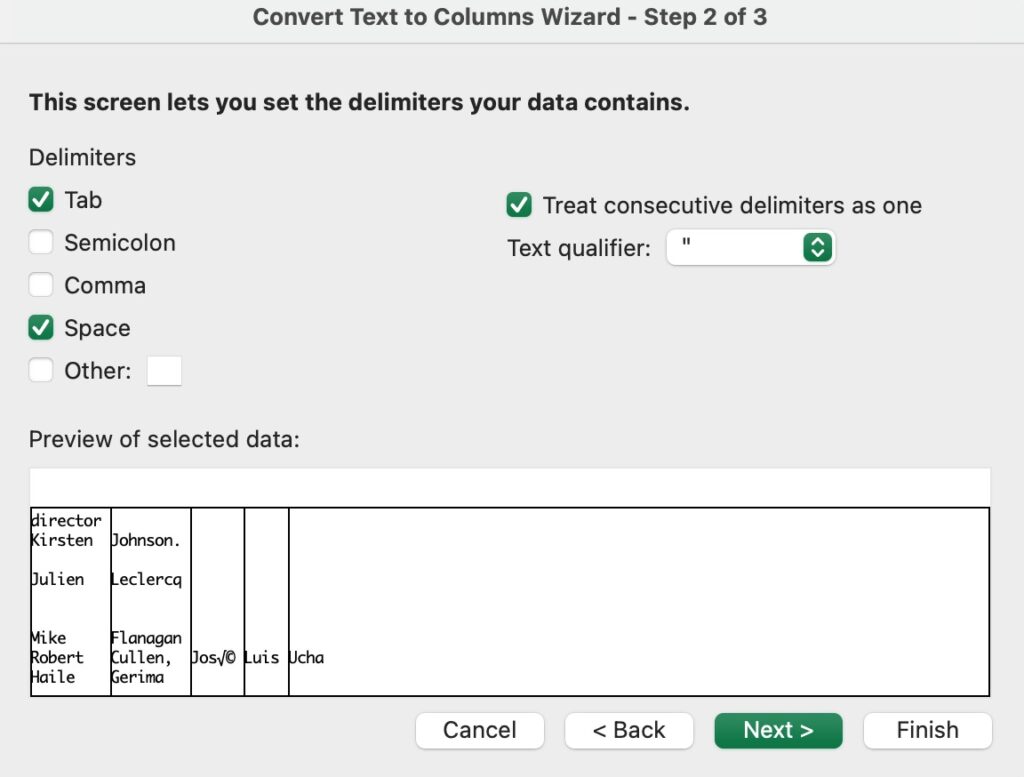
- Select Next.
- Select the Destination in your worksheet which is where you want the split data to appear.
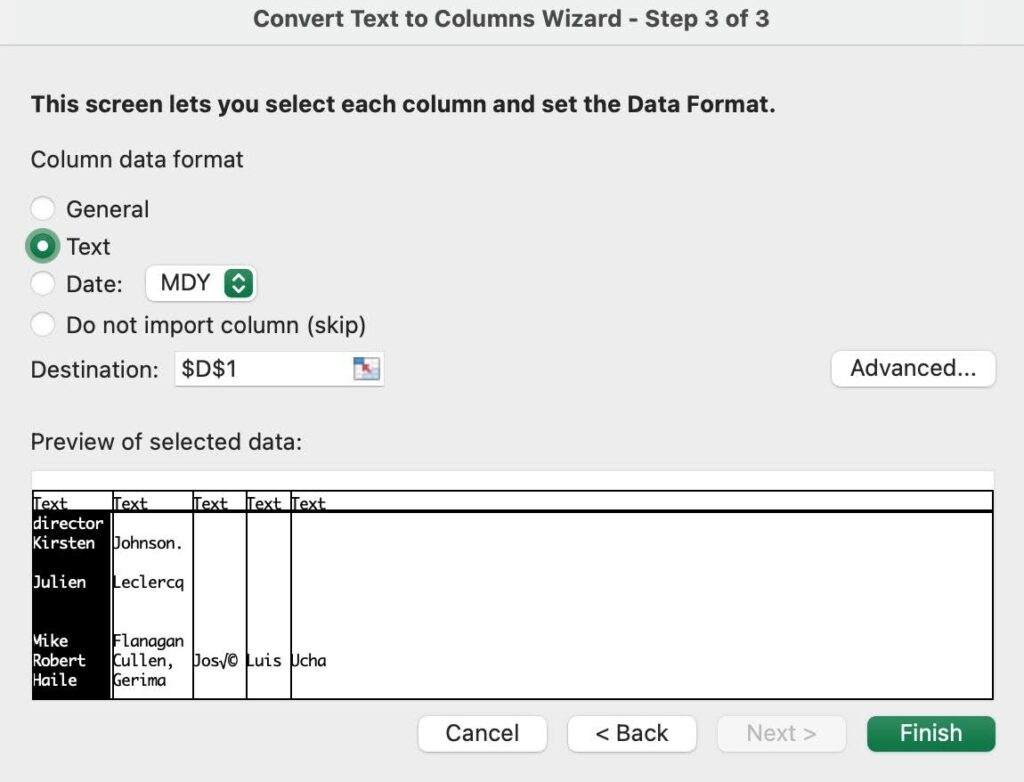
- Select Finish.
NOTE: Be careful when defining the destination columns, otherwise the information in the existing columns may be overwritten.
In Mammoth
To split delimited data in Mammoth, you just have to,
- Go to the Transform menu
- Find the Split into Multiple Columns under Column functions
- Select the column you want to split into multiple columns
- Specify the delimiter
- Select the number of columns you want to split the column into
- Enter names for the new columns
- Click Apply.
Instead of going through multiple steps in Excel, you can apply the function from a single widget in Mammoth. Further, you can split the column into as many columns as you like.
Not to mention, the rule automatically applies to all new data in the future.
See column splitting in action →
5. Find and replace {#replace}
Datasets may store values in multiple variations. For instance, Cupcake could be stored as cupcake, CUPCAKE, CUPcake, cUPcake, and so on. It’s important to standardize these values before processing them.
In Excel
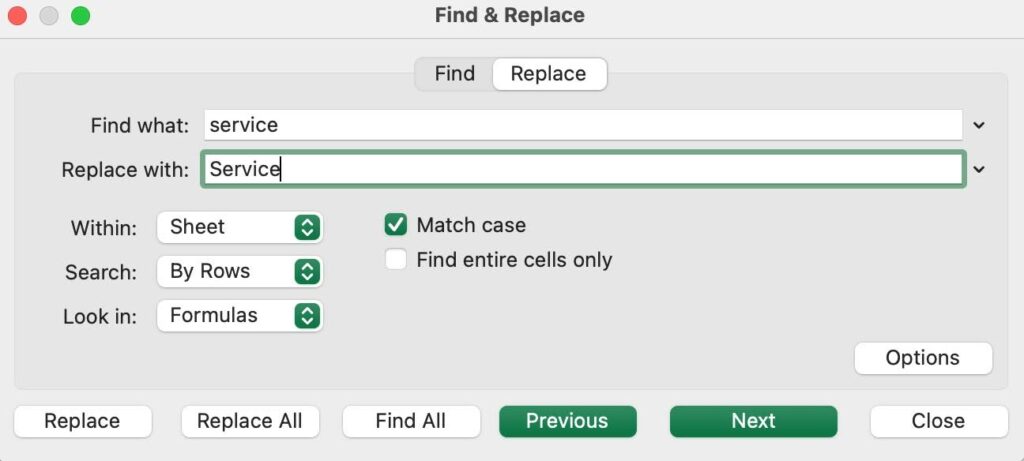
There is no bulk way to replace multiple values in Excel, however, you can use the Find and Replace function to replace values one by one.
Here’s how,
- Select the cell or column
- Go to Home > Find and Replace
- Enter a value in the Find what option
- Enter the value you want to replace it with
- Click on “Replace All” if you want to apply it to the whole sheet.
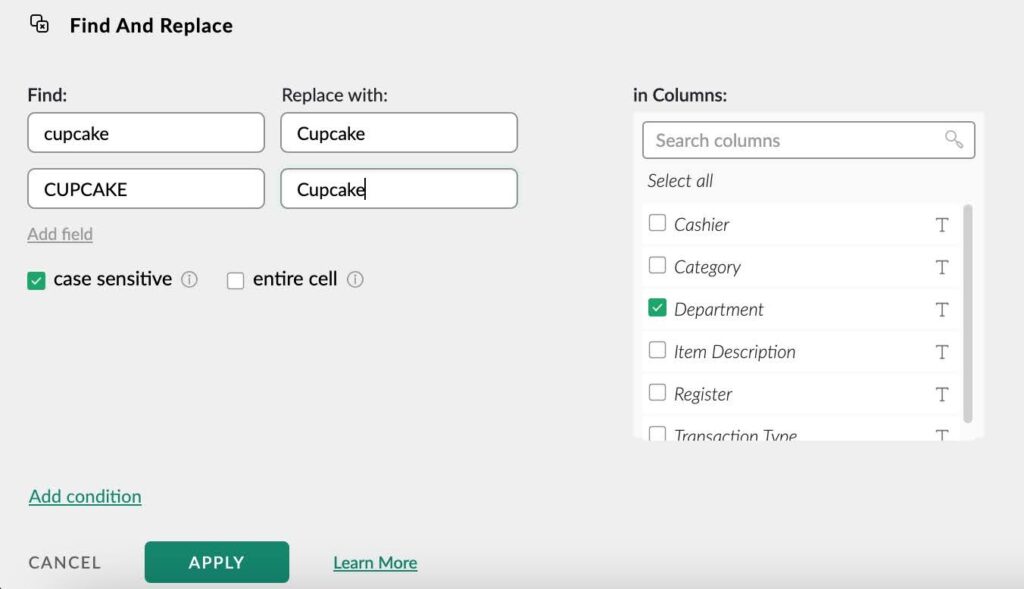
In Mammoth
Mammoth offers two functions to standardize values – Find and Replace and Bulk Replace.
The Find and Replace function can be applied to multiple columns, or even the whole dataset at a time.
Whereas the Bulk Replace function works on one column at a time but is a much more intuitive function than the Find and Replace function. Standardizing values works like a charm with the Bulk Replace function.
This is how you can replace the values with Find and Replace in Mammoth,
- Go to the Transform menu
- Find the Find and Replace function under Label, Filter and Replace
- Select a column
- Enter the value you want to replace
- Enter a new value you want to replace with
- Click Apply
And, with the Bulk Replace function,
- Go to the Transform menu
- Find the Bulk Replace function under Label, Filter, and Replace
- Select a column
- Put all similar values in a group
- Enter a new value for each group
- Click Apply.
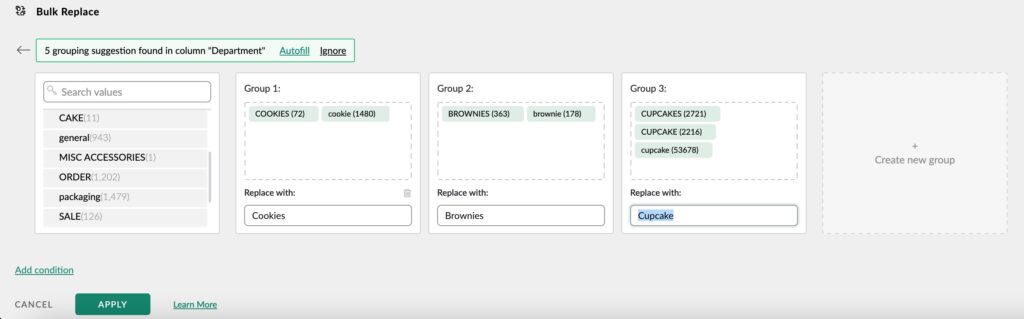
Bulk Replace function in Mammoth
And just like that you have replaced multiple values in a column with a fraction of effort. This will also apply to all new data the dataset may get.
Customer story: Inspired Learning Group (ILG) operates 23 schools across the UK. Each school submits reports with inconsistent naming conventions. Before Mammoth, consolidating these took 8+ hours monthly. With Mammoth’s Bulk Replace automation, this runs automatically with zero manual hours.
6. Extract prefixes and suffixes {#extract}
Certain values such as OrderID, ItemID, or Model number often nest a lot of information like demography details, manufacturing details, processing details, and so on.
While this could be valuable information for analysis, it’s difficult to use until we extract it as a separate value.
In Excel
In Excel, we use the LEFT and RIGHT functions to extract prefixes or suffixes.
This is how,
- Insert a new column next to the column you want to extract text from
- Select the cell or column
- Write the formula – =LEFT(text, [number of chars])
- Drag the rule to apply to all the cells.
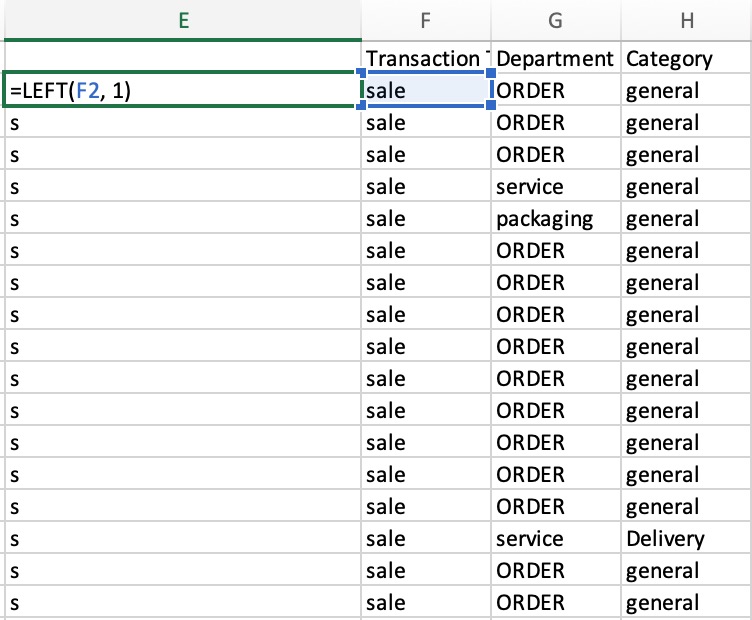
LEFT function in Excel
In Mammoth
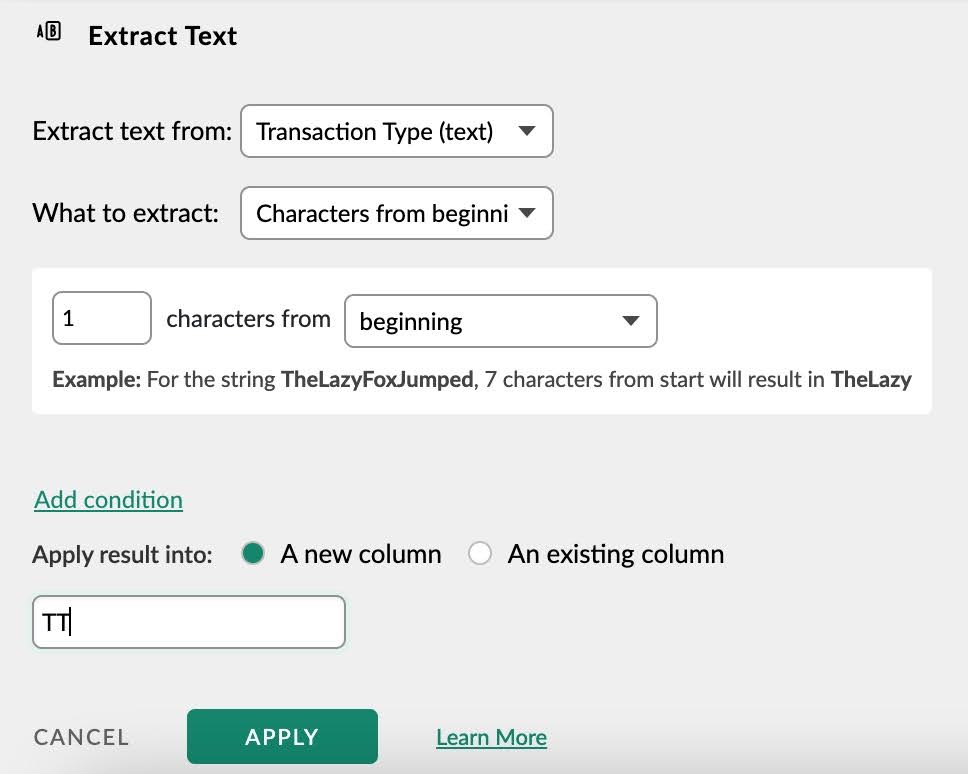
You can simply use the “Extract Text” to extract text,
- Go to the Transform menu
- Find the Extract Text under Text functions
- Select extraction method (first N characters, last N characters, text between delimiters)
- Name the new column
- Click Apply.
7. Check for spelling and typos {#spelling}
Misspelled terms or typos can occur anywhere. It’s good practice to check your data for spelling mistakes.
In Excel
The spell check function in Excel is great for spell checks,
- Select a cell or column
- Go to Review > Spelling
- Excel would suggest the correct spelling or similar words if there are wrong spellings. You can choose the value you want and it will get replaced everywhere in the column.
- If all spellings are correct, it will show a checkmark.
In Mammoth
Mammoth currently doesn’t offer spell check as a built-in feature.
8. Fill missing values {#fill}
Missing values stem from poor data records or data entry errors. You can choose to either remove the missing values or impute and fill them.
Having complete data helps in data processing & modeling and you should strive to have zero blank cells in your data.
However, if there are missing values in a column that you are not going to need at all for your analysis, you can simply ignore those.
In Excel
To fill in missing values in Excel,
- Highlight the range starting before and after the missing values
- Click Home > Editing > Fill > Series.
This might not work if the data is not in a sequential order.
In Mammoth
To fill in missing values in Mammoth,
- Go to the Transform menu
- Find the Fill missing values under Column functions
- Select if you want to fill with the value above or with the value after
- Click Apply.
Start automating your data cleaning →
What Mammoth Customers Say
HP: Journal Entry Automation
Challenge: Finance team spent entire afternoons manually creating journal entries from multiple Excel files.
Result: 4-hour manual process reduced to 15-minute automated workflow. Now runs daily instead of monthly.
Starbucks: Multi-Country Data Processing
Challenge: Processing 1 billion+ rows across 17 countries with different formats, currencies, and naming conventions.
Result: Eliminated 100+ hours of monthly manual work. Data consolidation that took 20 days now completes in hours.
Financial Services: Complex Data Consolidation
Challenge: Consolidating machine sales data across 15 Excel sheets with complex accounting rules took 3-4 months.
Result: Quarterly process now completes in approximately 2 hours.
Frequently Asked Questions
How long does it take to learn Mammoth?
Most analysts are productive within 15 minutes. If you understand Excel logic, you’ll understand Mammoth – it’s visual and intuitive with no coding required.
Will Mammoth work with my data?
Mammoth handles Excel files (XLSX, XLS, CSV), databases (SQL Server, MySQL, PostgreSQL), cloud storage (Google Drive, OneDrive, S3), and 100+ data connectors.
What if I need to change something later?
Every pipeline is fully editable. Add steps, remove steps, modify logic – changes take seconds and apply to all future data automatically.
Is my data secure?
Mammoth is SOC 2 Type II certified and ISO 27001 compliant. Your data is encrypted at rest and in transit, with role-based access control and detailed audit logs.
How much does Mammoth cost?
Plans start at $16/month for individual analysts. Most organizations achieve ROI within 2-4 weeks. View pricing →
Data Cleaning in Excel: Conclusion
If you are still going through the same rigorous data cleaning routine every time, this is the time to change. Adapt to intuitive and automated solutions like Mammoth Analytics for smooth data management and processing.
Struggling with messy data in Excel? Fix it with Mammoth!
Join thousands of data pros who streamline their workflow with Mammoth. Start your free trial today and see how Mammoth simplifies your data prep.
Ready to Stop Repeating the Same Data Cleaning Tasks?
Option 1: Start Your Free Trial
Set up your first automated pipeline and see how it works with your actual data.
Start Free Trial
Option 2: See It In Action
Schedule a personalized demo to see how Mammoth handles your specific data cleaning challenges.
Book a Demo
Option 3: Learn More