Custom transformations
Mammoth's visual pipeline covers most transformation needs, but some business logic is too complex for a single task. This guide is for data engineers and advanced analysts. It covers four techniques for advanced logic: chaining standard tasks, using the Generative AI task as a programmable transform, pre-processing in the source system, and two-pass processing. It ends with what Mammoth cannot do.
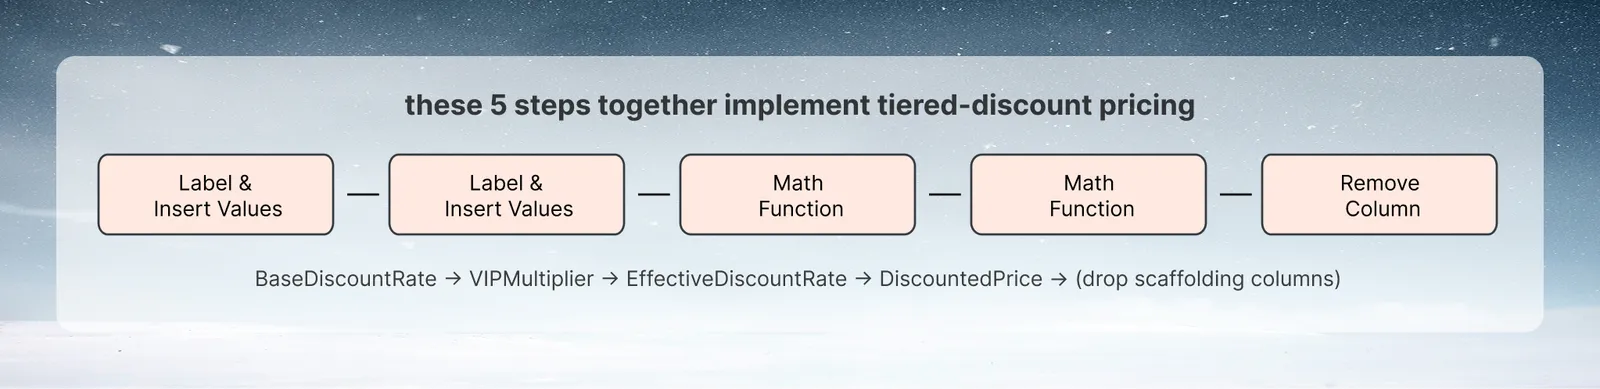
These five tasks together implement tiered-discount pricing: BaseDiscountRate, VIPMultiplier, EffectiveDiscountRate, DiscountedPrice, then drop the scaffolding columns.
Technique 1: Chaining steps for complex logic
Most complex logic can be broken into sequential simple tasks. Intermediate columns do not need to be in the final output. They are scaffolding that you drop at the end.
Example: Tiered pricing with volume discounts
Business rule: "Apply a 5% discount for orders 10–24 units, 10% for 25–49, 15% for 50+. But if the customer is a VIP account, apply 1.5× the standard discount tier."
Implementation:
- AI SQL Query:
BaseDiscountRate = CASE WHEN Quantity >= 50 THEN 0.15 WHEN Quantity >= 25 THEN 0.10 WHEN Quantity >= 10 THEN 0.05 ELSE 0 END(or use Label & Insert Values with a condition on Some cells once per tier) - AI SQL Query:
VIPMultiplier = CASE WHEN AccountTier = 'VIP' THEN 1.5 ELSE 1.0 END - Math Function:
EffectiveDiscountRate = "BaseDiscountRate" * "VIPMultiplier" - Math Function:
DiscountedPrice = "UnitPrice" * (1 - "EffectiveDiscountRate") - Remove Column: drop
BaseDiscountRateandVIPMultiplierfrom the output
Each task is simple and auditable. Together they implement the tiered logic.
Example: Running balance calculation
Business rule: "Calculate the running account balance after each transaction (deposits add, withdrawals subtract, ordered chronologically per account)."
Implementation:
- AI SQL Query:
SignedAmount = CASE WHEN TransactionType = 'Deposit' THEN Amount ELSE Amount * -1 END - Window function: function Sum on
SignedAmount, Type Accumulate, Group byAccountID, Add Sort onTransactionDateascending, placed in a newRunningBalancecolumn - Remove Column: drop
SignedAmountif not needed in output
The Window function task handles the ordered running sum natively, so no looping is needed.
Technique 2: Generative AI as a programmable transform
The Generative AI task can implement transformation logic that does not fit any standard task. Think of it as a programmable transform where the "code" is a natural language instruction. (This is a different feature from the AI Prompt search bar, which generates pipeline tasks from a typed instruction. This technique is about the Generative AI task itself.)
When to use Generative AI as a transform
- Complex conditional logic with many branches (>10 conditions)
- Business rules that reference external knowledge (e.g., "classify this product into our taxonomy")
- Free-text parsing where regex isn't sufficient
- Multi-criteria scoring that would require many condition-based tasks
Structured output from Generative AI
The task's output column is always text, so for the result to be usable in downstream steps, force the model to return a consistent, parseable string:
Single value output:
"Return only a single word from this list: 'Core', 'Premium', 'Enterprise'. No explanation."
Multi-field output (JSON):
"Parse this address into JSON with keys 'street', 'city', 'state', 'zip'. Return only valid JSON, no explanation."
For JSON output, add an Extract JSON task after Generative AI to pull each JSON key into its own column.
Numeric output:
"Score the quality of this product description from 0 to 10. Return only the number.". The result is still a text column; add a Math Function task afterward if you need to use it as a number.
Multi-step logic in one Generative AI call
For complex rules that would require many condition-based tasks:
Using the Amount, DaysToClose, StakeholderCount, and DaysSinceLastActivity columns, apply our deal scoring rubric:
Size >= $100K and close <= 30 days → "Hot"Size >= $50K and close <= 60 days and last activity <= 7 → "Warm"Last activity > 30 days → "Stale" (regardless of other factors)Otherwise → "Pipeline"
Return only one word: Hot, Warm, Stale, or Pipeline.
This single Generative AI task replaces many nested condition-based tasks. Select the referenced columns (Amount, DaysToClose, and so on) as the task's context columns. Generative AI supports up to 20 context columns, well above what a rule like this needs.
Technique 3: Pre-processing at the source
Some transformations are better done in the source system before data enters Mammoth.
Pre-processing in SQL
If your source is a SQL database with a Live Connection, use the SQL query box when adding the data to perform the complex logic before it enters Mammoth:
SELECT
o.*,
DATEDIFF(o.close_date, o.created_date) AS days_to_close,
CASE
WHEN o.amount >= 100000 THEN 'Enterprise'
WHEN o.amount >= 25000 THEN 'Mid-Market'
ELSE 'SMB'
END AS deal_size_tier,
u.name AS owner_name,
u.region AS owner_region
FROM opportunities o
JOIN users u ON o.owner_id = u.id
WHERE o.stage NOT IN ('Closed Lost')
Benefits:
- SQL runs at database speed
- Reduces the data volume sent to Mammoth
- Leverages database indexes for filtering and joining
- Complex SQL window functions often outperform Mammoth equivalents for very large datasets
Tradeoffs:
- Logic is in the SQL query, not in the Mammoth pipeline (less visible to non-SQL analysts)
- Changes require SQL access, not just Mammoth editor access
- Mammoth's visual audit trail doesn't cover logic in the source query
Exporting from a BI tool
For transformations already defined in another BI tool (Tableau calculated fields, Power BI measures, Salesforce reports), export the result as a file rather than re-implementing the logic in Mammoth. Import the pre-calculated file and join it to Mammoth datasets.
Technique 4: Two-pass processing
Some transformations need context from the full dataset before individual rows can be processed. The two-pass pattern handles this.
Example: percentile-based segmentation
To assign each customer to a revenue tier based on where they fall in the distribution, you can often skip the two-pass pattern: a Window function with Percent rank or N tile on the revenue column (Type Aggregate) adds the rank to every row in one step. When you need your own thresholds instead:
- First pass:
Group & Pivotto calculate summary statistics for the full dataset:Min,Max,Average - Send these to a single-row reference dataset
- Second pass:
Lookupeach customer record against the reference dataset to join the thresholds Label & Insert Values(with a condition on Some cells) or AI SQL Query: compare each customer's revenue to the thresholds → assign tier
The first pass gives you the distribution context; the second pass applies it per row.
Example: Z-score normalization
- First pass:
Group & Pivot→AVG(Value)asMean,STDDEV(Value)asStdDev - Second pass:
Lookupeach row to the Mean and StdDev values Math Function:ZScore = ("Value" - "Mean") / "StdDev"
What Mammoth cannot do
Some transformations require code:
- Recursive calculations (hierarchical rollups with arbitrary depth)
- Matrix operations or linear algebra
- ML model inference (beyond what the Generative AI task can do)
- Complex text parsing with backtracking regex
For these cases, the recommended pattern:
- Process the data in Mammoth up to the point where you need custom code
- Export to BigQuery (or another database destination) where you can use SQL UDFs or Python UDFs
- Import the result back into Mammoth for final transformation and delivery
Or, for data engineering teams: perform the custom computation in Python/dbt as a pre-processing step and bring the result into Mammoth as a source dataset.