Financial reporting use case
Month-end reporting involves mechanical work: pulling GL exports, matching formats across entities, calculating year-over-year and month-over-month variances, and formatting the results. This guide is for controllers and FP&A analysts. It shows how to automate that work in Mammoth.
What you will build: A recurring financial reporting pipeline that consolidates multi-entity GL data, computes period-over-period comparisons, and produces ready-to-share P&L and variance reports.
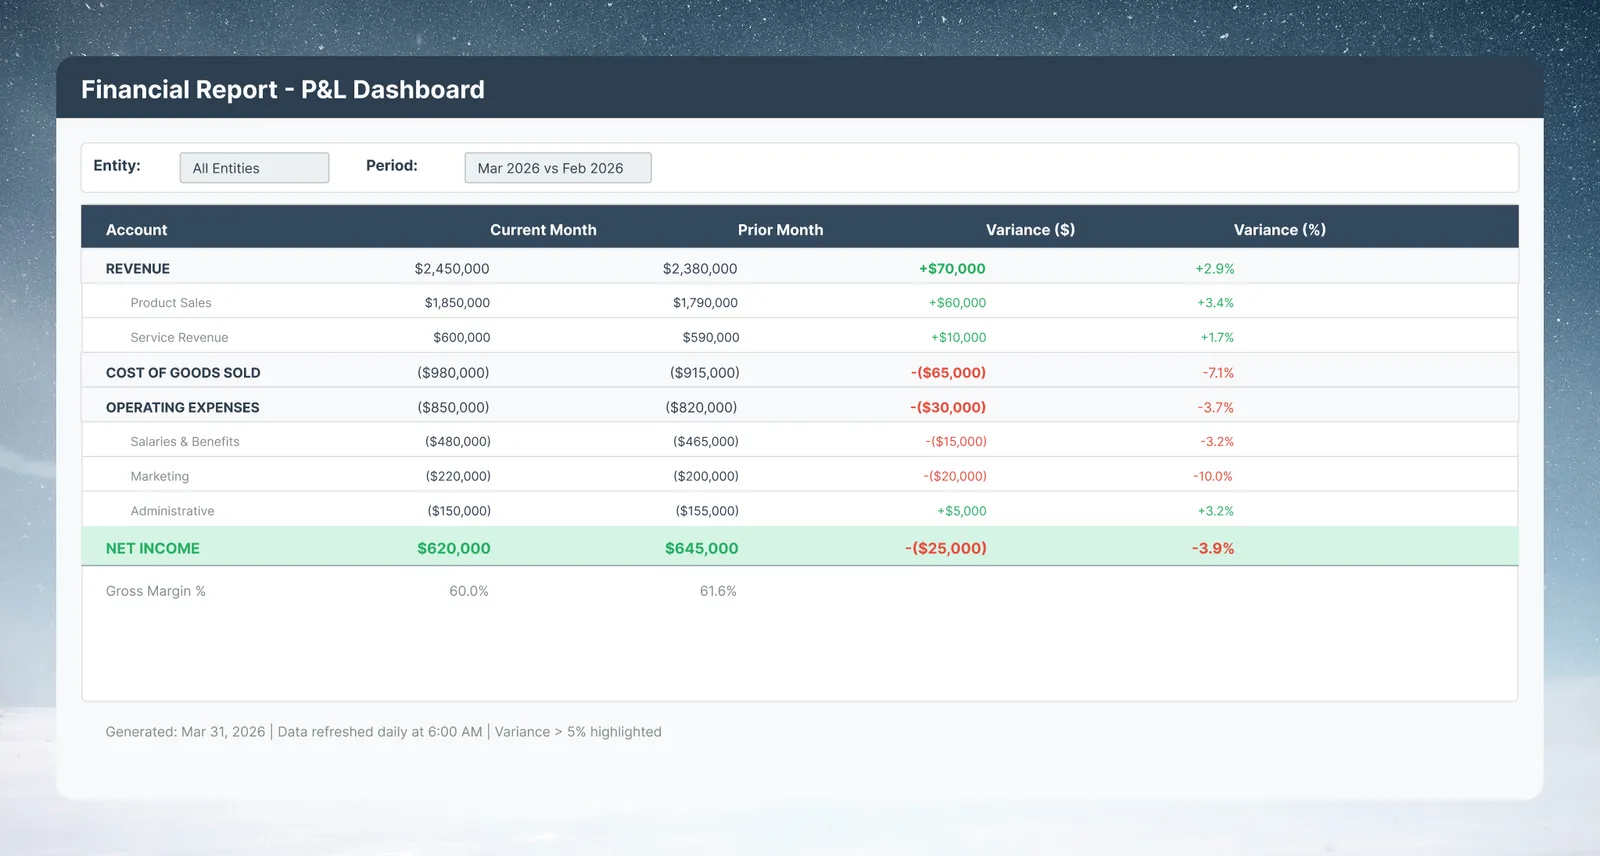
The challenge of multi-entity month-end close
A typical monthly close workflow for a multi-entity company:
- Finance team pulls GL exports from an ERP (SAP, NetSuite, QuickBooks, and others), one per entity
- Each entity uses slightly different account code formats and naming conventions
- An analyst spends hours in Excel: vlookups, format fixes, manual variance calculations
- The final P&L goes to leadership days after the period closes
In Mammoth, steps 2 to 4 are automated. The only manual step is uploading the GL export, which a connector to your ERP or database can also automate.
Requirements
- GL export files per entity (CSV or Excel), or a connector to your ERP or database
- A chart of accounts mapping file (maps account codes to standardized names)
- Mammoth workspace with at least one project
Step 1: Set up your data structure
Upload GL exports
- In your project's Data Library, click + New Dataset and upload a file
- Upload your GL export for the current period
- Repeat for each entity, naming datasets consistently:
GL_EntityA_2026_03,GL_EntityB_2026_03
Tip: Append monthly files
If you do this monthly, use Add or Replace Data with Combine with older data to append new period files to the same dataset. See Batch management.
Upload the chart of accounts
- Click + New Dataset and upload your chart of accounts mapping file as a separate dataset
- This file should have at minimum:
AccountCode,AccountName,Category(Revenue, COGS, OpEx, etc.),SubCategory
Step 2: Standardize account codes
Different ERP systems and entities export account codes in different formats. Normalize them before joining.
- Open your GL dataset in the Data Editor
- If account codes have inconsistent padding (e.g., "1000" vs "01000"), type in the Describe your transformation bar (the AI Prompt bar)
- Type: "Standardize AccountCode to 6-digit zero-padded format"
- Review the suggested task and apply
- Repeat for each entity dataset
Handle entity-specific naming:
- Add a Bulk Replace task on the
AccountNamecolumn - Map entity-specific names to the canonical names from your chart of accounts
Step 3: Consolidate entities
Join all entity GL files into a single consolidated dataset.
- In each entity dataset, add a Conditional Filter to scope to the current period
- Add an
Entitycolumn to each (Add column, then Label & Insert Values with the entity name). This preserves which rows belong to which entity after consolidation - Create the consolidated dataset from Entity A, then for each other entity open Add or Replace Data on it, choose Select existing, pick the entity's dataset, and use Combine with older data
Step 4: Join chart of accounts
- Add a Lookup task
- Join on
AccountCode(your GL dataset) →AccountCode(chart of accounts) - Pull in:
AccountName,Category,SubCategory,ReportingOrder
This gives every GL row a standardized category label, which you need for grouping in the P&L.
Step 5: Calculate period-over-period comparisons
To show current versus prior period variance, you need both periods in the same dataset.
Option A: Aggregated comparison (two Views joined)
- Add a Group & Pivot task: group by
AccountCode,Category,SubCategory; sumAmountfor current period - Add a second aggregation task scoped to prior period using Conditional Filter + Group & Pivot
- Join the two aggregation outputs on
AccountCodeusing Lookup - Add a Math Function task to calculate:
Variance_Abs = "CurrentAmount" - "PriorAmount"Variance_Pct = ("CurrentAmount" - "PriorAmount") / ABS("PriorAmount") * 100
Option B: Use Window function for rolling comparisons
For rolling 12-month or YTD comparisons:
- Use Window function with the Lag function to pull prior-period values within the same dataset
- Set Group by to
AccountCodeand Add Sort onPeriodDate
Step 6: Build the P&L view
- Add a Group & Pivot task: group by
CategoryandSubCategory, enable pivot to reshape from long format (one row per period) to wide format (columns = months) - In the Group & Pivot configuration, set the column to pivot on as
PeriodDateand order the output columns chronologically
The resulting View is your automated P&L—ready for a dashboard or export.
Step 7: Build and share the dashboard
- Click + Create Dashboard from your P&L View
- Prompt: "Show a P&L table with current month, prior month, variance $, and variance %, and highlight negative variances in red"
- Add filters: entity, department, date range
- Click Publish & Share → set Access Type to Authenticated for internal finance team, or Public if you need to share with external auditors who do not have Mammoth accounts
Export options:
- Download as Excel or CSV for auditors or leadership who prefer spreadsheets
- Live Link: an auto-updating URL that reflects the latest data every time the pipeline runs
- Export → a database or file destination: push to BigQuery, PostgreSQL, SQL Server, Redshift, or SFTP for use in Tableau or Power BI (see Send to destinations)
Step 8: Automate monthly close
- Open Automations in the project sidebar → New Automation → Dataset Refresh (if the GL comes from a connector)
- Or set up a Messaging automation to email the P&L View as a CSV attachment to your CFO and controller on a fixed day each month
- Configure: repeat every 1 Month on the 3rd at 7:00 AM (schedules run on a fixed day of the month, not on business days)
- Attach: the P&L View
Results to expect
Once the pipeline is in place:
- Close prep is the review of the output, not the manual cleanup
- The consolidated, multi-entity view updates as soon as new GL data is loaded
- Leadership can open the published dashboard themselves instead of waiting on one analyst
- The transformation tasks are recorded in the pipeline, so the same logic runs every period
Variations for budget, EBITDA and currency
Budget versus actuals
Upload your budget file as a separate dataset and join it to actuals on AccountCode + Period. Add Budget, Actual, and Variance columns.
EBITDA calculation
After consolidation, add a Math function task:
EBITDA = Net Income + Interest + Taxes + Depreciation + Amortization
Map your chart of accounts SubCategory values to the EBITDA components.
Multi-currency
Add a currency conversion lookup table and a Math function task to normalize all amounts to your reporting currency before aggregation.