Data quality monitoring use case
Bad data does not announce itself. It shows up as a P&L with impossible negative margins, a customer count that drops overnight, or a compliance report that passes internal review and fails audit. By then, the damage is done.
This guide is for data quality managers, analysts, and operations managers. It shows how to build automated data quality monitoring in Mammoth: checks that run on every data refresh, flag anomalies, and alert your team before bad data reaches downstream systems.
What you will build: A data quality pipeline with automated checks and failure notifications when quality thresholds are breached.
The challenge of manual data quality checks
Manual data quality checks are:
- Slow: by the time someone notices, reports have already gone out
- Incomplete: teams check what they think might break, not what actually breaks
- Unscalable: each new data source multiplies the checking burden
In Mammoth, you embed quality gates directly in the pipeline so checks run automatically on every run.
Step 1: Use the built-in data quality report
Before building custom checks, run Mammoth's automatic quality analysis.
- Open your dataset
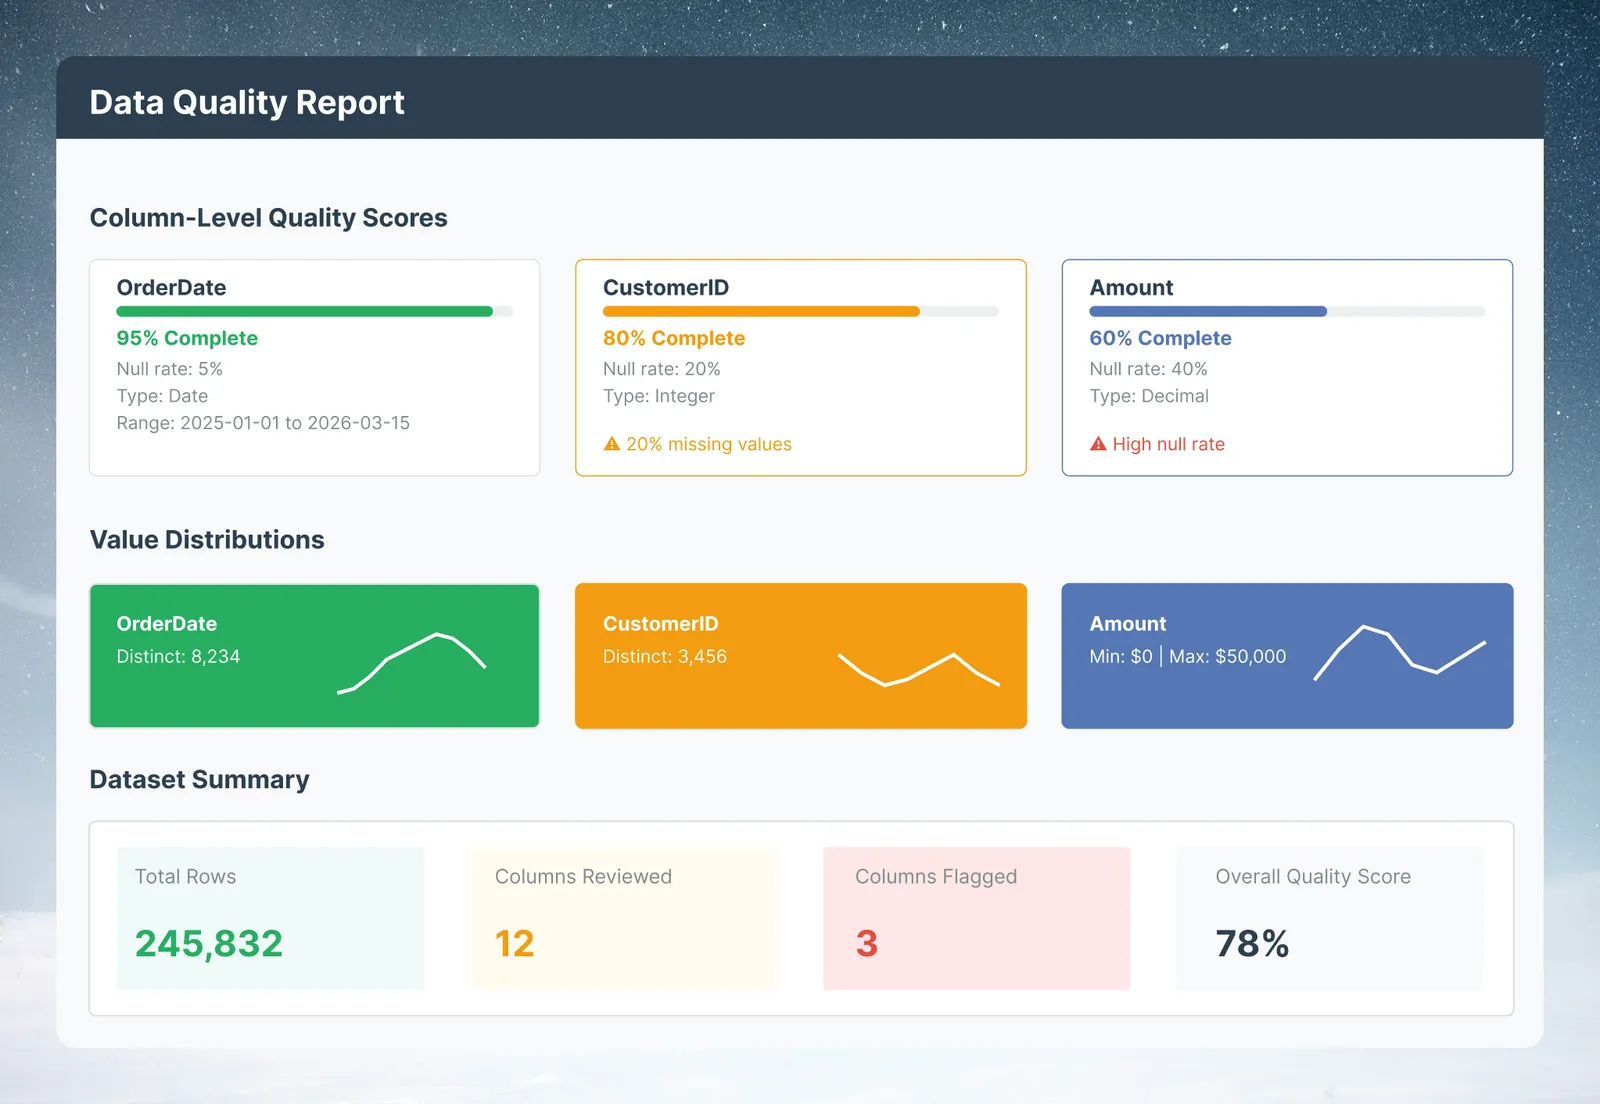
- Click the View Data Quality button in the bottom-right of the dataset view (shows your quality score)
- Review the report:
- Null rate per column: flag anything above your tolerance threshold
- Distinct value count: unexpectedly high or low counts indicate data issues
- Format consistency: mixed types and suspicious patterns
- Statistical outliers: values outside expected ranges
Tip: Record a baseline
Note the initial findings (null rates, distinct counts) as your baseline, and use them to pick thresholds for your Data Check rules in the next steps.
Step 2: Define your quality rules
Translate your data knowledge into explicit checks. The Data Check pipeline task runs them on every pipeline run. Common rules:
| Rule type | Example | Data Check type |
|---|---|---|
| Null check | CustomerID must never be null | Null percentage |
| Range check | OrderAmount must be between $1 and $1,000,000 | Value range |
| Duplicate check | OrderID must be unique | Unique values |
| Referential integrity | All ProductID values must exist in the product catalog | Lookup against the catalog, then a Custom prompt check that no looked-up value is empty |
| Format check | All Email values must match email format | Custom prompt (describe the rule in plain language) |
| Statistical bound | Row count must be within ±20% of prior run | Row count with the changed by more than condition |
Step 3: Add the Data Check task
- Open your dataset in the Data Editor and add a Data Check task after your transformation tasks (it can be pinned to the end of the pipeline)
- Click Add check and choose a check type. Repeat for each rule from Step 2:
- Null percentage on
CustomerIDwith the conditioneq0 - Value range on
OrderAmount, between 1 and 1,000,000 - Unique values on
OrderID - Row count with changed by more than 20%, compared with the prior run
- Null percentage on
- For referential integrity, add a Lookup on
ProductIDagainst your product catalog first, then add a Custom prompt check such as "ProductName is never empty" - Choose how strict each check is with its tolerance (fail on any violating row, or only when more than 1%, 5%, or 10% of rows violate)
Step 4: Choose what happens on failure
Each Data Check task has one fail action:
- Flag and continue: the pipeline runs normally and the failure is flagged. Use this for warnings.
- Pause the pipeline: downstream tasks are blocked until you fix the data or approve it. Use this for critical rules.
To use both levels, add two Data Check tasks: one with the warning-level rules set to Flag and continue, and one with the critical rules set to Pause the pipeline.
The Data Check card in the pipeline shows Passed, Failed, Bypassed, or Not run. Open it to see each check's result and run details.
Step 5: Set up automated alerts
- In each Data Check task, turn on Notify on failure and select the recipients
- Send warnings to the data team only; send critical failures to the business owner as well
- To also receive a scheduled summary, go to Automations → New Automation → Messaging, select the View to attach (it is attached as a CSV), and choose a schedule
Tip: Watch Needs Attention
Watch the Needs Attention tab in Monitor for paused or failed items across your project.
Step 6: View insights for automated anomaly detection
For datasets where you do not know in advance what "bad" looks like:
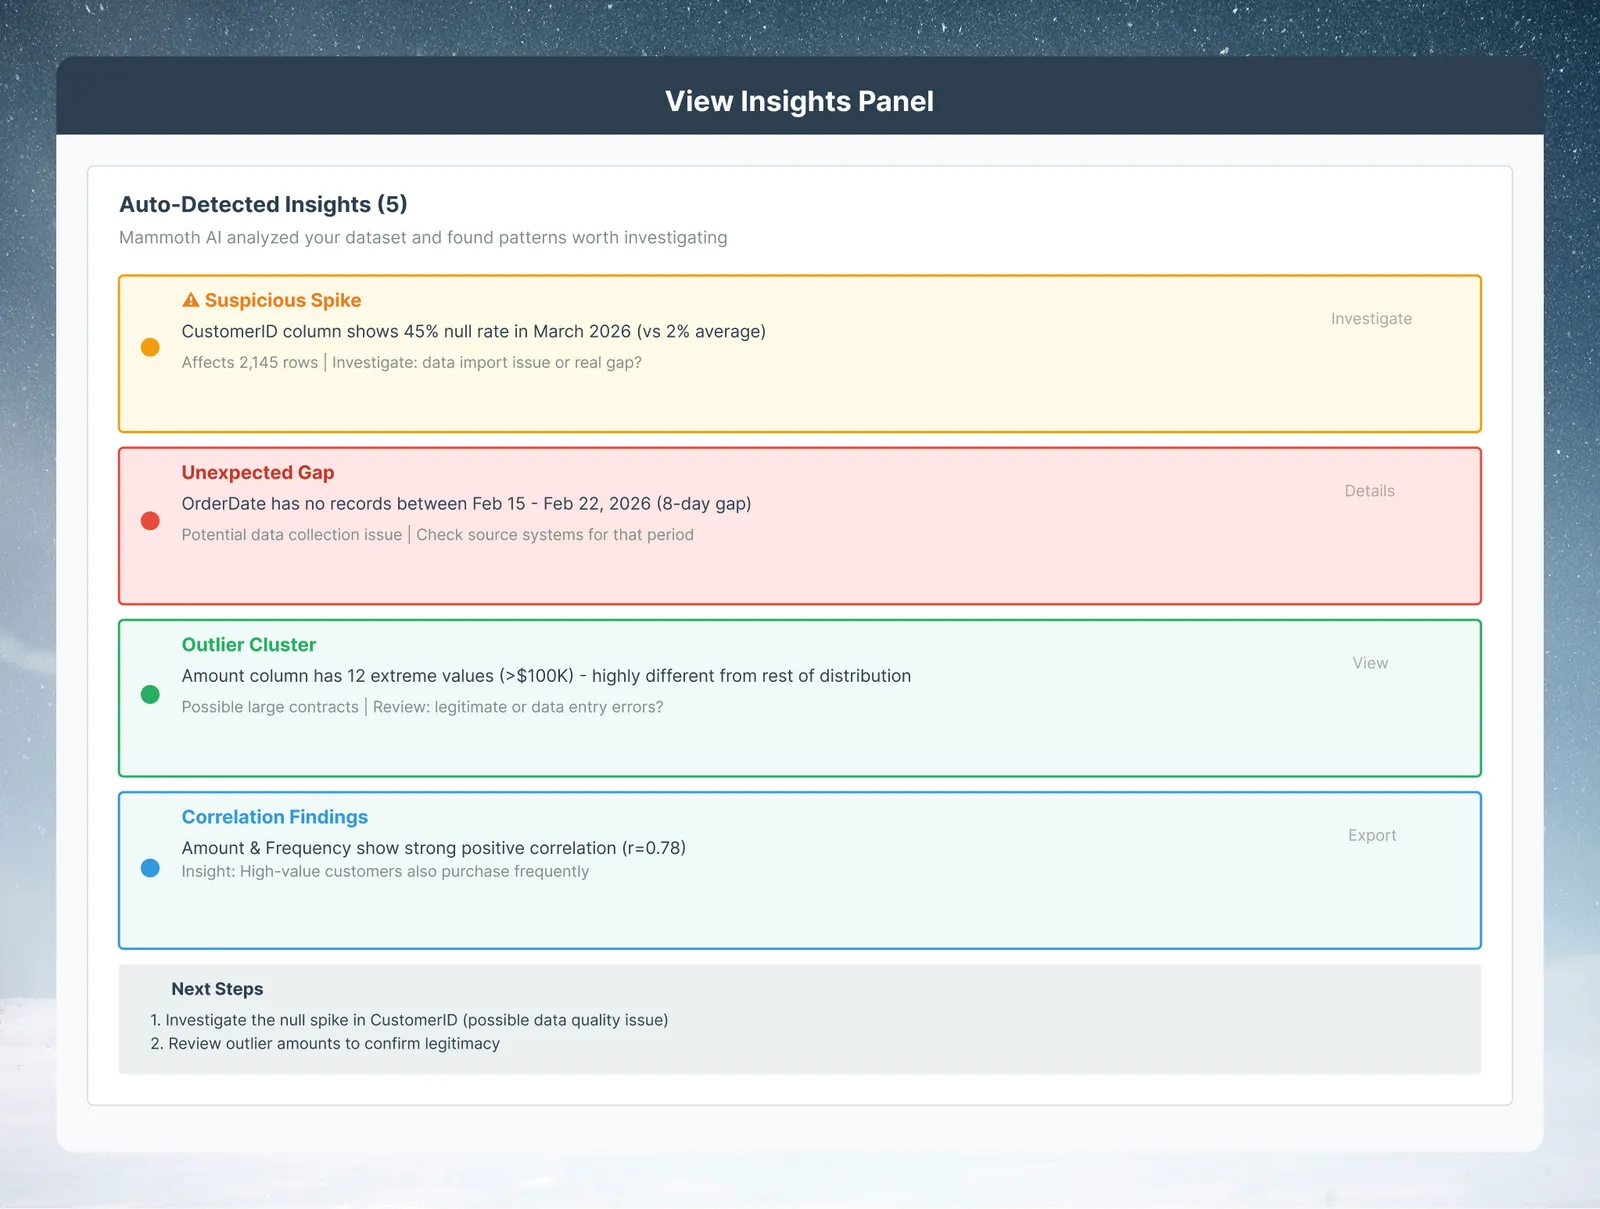
- Open your dataset → click View Insights (the AI insights panel)
- Mammoth analyzes the data and surfaces a set of AI-generated insights
- Look specifically for: unusual distributions, unexpected correlations, outlier clusters
- Any insight that looks wrong is a quality issue. Drill in with a filter to investigate
Results to expect
- Detection: problems surface in the same pipeline run that introduces them, instead of after a report has gone out
- Coverage: every refresh runs the same checks, instead of ad hoc spot checks
- Downstream protection: a check set to Pause the pipeline blocks downstream tasks until the data is fixed or approved
Variations: vendors, audit trail and threshold tuning
Multi-source quality comparison
If you receive data from multiple vendors in the same schema, run quality checks on each source separately and compare scores. Vendors with consistently lower quality scores get flagged for remediation conversations.
Compliance-grade audit trail
For SOX or HIPAA compliance, use the Activity Log (Enterprise plans can export it) as a timestamped record of pipeline runs and user actions. It does not record individual check values, so keep your own log of check results if auditors need them.
Threshold tuning
After your first month of monitoring, review your false positive rate. If too many warning emails are noise, relax the thresholds. Use the Data Check run details to see how close your data came to each threshold, and set data-driven thresholds from that.