Customer cohort analysis
Aggregate customer data hides the most important story: which customers are growing, which are at risk, and which segment drives most of your revenue. This guide is for marketing, product, and customer success analysts. It shows how to build an RFM (Recency, Frequency, Monetary) segmentation and customer lifetime value model in Mammoth.
What you will build: An automated customer segmentation pipeline that scores every customer on three dimensions, assigns them to named segments (Champions, At Risk, Hibernating, etc.), and produces a dashboard your marketing and success teams can act on.
Requirements
- Transaction or order history dataset (at minimum: CustomerID, OrderDate, OrderAmount)
- Optional: Customer attributes table (region, industry, acquisition channel)
- A Mammoth workspace and project
The RFM framework
| Dimension | Definition | Why it matters |
|---|---|---|
| Recency (R) | Days since last purchase | Recent buyers are more likely to buy again |
| Frequency (F) | Number of purchases in window | High frequency = strong relationship |
| Monetary (M) | Total spend in window | Guides where to focus retention effort |
Each dimension gets a score from 1–5. Combined, they create 125 possible RFM combinations, which Step 3 condenses into a handful of actionable segments.
Step 1: Calculate RFM metrics per customer
Recency
- Open your transaction dataset in the Data Editor
- Add a Group & Pivot task: group rows by
CustomerID, withMaxofOrderDateasLastPurchaseDate - Add a Calculate date difference task: Start Date
LastPurchaseDate, End Date Current Time (UTC), unit Days, new columnRecencyDays
Frequency
- In the same Group & Pivot task, add + Count to get
TotalOrders
Monetary
- Add
SumofOrderAmountasTotalSpendin the same task
You now have one row per customer with RecencyDays, TotalOrders, and TotalSpend.
Step 2: Score each dimension 1–5
Use the Window function task with N tile (5 buckets) to assign quintile scores based on your actual data distribution:
- Add a Window function task, choose N tile, select the
RecencyDayscolumn, and add a sort onRecencyDaysascending - Place the result in a new column named
R_Score. Score 1 is the most recent customers (lowestRecencyDays) and score 5 the least recent - Repeat for
TotalOrders→F_Score, sorting ascending so that 5 = most orders - Repeat for
TotalSpend→M_Score, sorting ascending so that 5 = highest spend
Tip: N tile adapts to your data
N tile splits the customers into five equal-sized groups using their actual values, so the thresholds adapt to your data distribution regardless of dataset size or skew.
Step 3: Assign named segments
Combine the three scores into a single RFM_Code and use AI SQL Query to assign segment names:
- Add a Combine columns & text task: combine
R_Score,F_Score,M_Scorewith no separator → output columnRFM_Code(e.g., "555", "123", "421") - Add an AI SQL Query task
- Describe the segmentation rule:
"Add a column CustomerSegment that assigns each row a segment name based on RFM_Code using these rules:
- Champions: R=5, F=4–5, M=4–5
- Loyal Customers: F=4–5, M=3–5, R=3–5
- At Risk: R=1–2, F=3–5, M=3–5
- Can't Lose Them: R=1–2, F=4–5, M=4–5
- Potential Loyalists: R=4–5, F=1–2, M=1–3
- New Customers: R=5, F=1, M=1–2
- Hibernating: R=1–2, F=1–2, M=1–3
- Lost: R=1, F=1, M=1
- Everyone Else: all other combinations"
- Review the generated SQL and apply. Name the output column
CustomerSegment.
Step 4: Calculate customer lifetime value
Add lifetime value metrics to each segment:
Average Order Value (AOV)
AOV = TotalSpend / TotalOrders
Add it with the Math function task: "TotalSpend" / "TotalOrders"
Predicted Annual Value
PredictedAnnualValue = (TotalOrders / tenure_months * 12) * AOV
Where tenure_months comes from a Calculate date difference task (Start Date FirstPurchaseDate, End Date Current Time (UTC), unit Months). Add Min of OrderDate as FirstPurchaseDate in the Step 1 Group & Pivot task.
Segment averages
Add a second Group & Pivot task (set Place the result in to a new dataset):
- Group rows by
CustomerSegment - Calculate:
AverageofTotalSpend,TotalOrders, andRecencyDays, plus a Count
Step 5: Enrich with customer attributes
If you have a customer attributes table (region, industry, acquisition channel):
- Add a Lookup task
- Join on
CustomerID - Pull in
Region,Industry,AcquisitionChannel
This enables segment breakdown by acquisition source, which you need for marketing ROI analysis.
Step 6: Build the dashboard
- Click Create Dashboard from your customer-level View
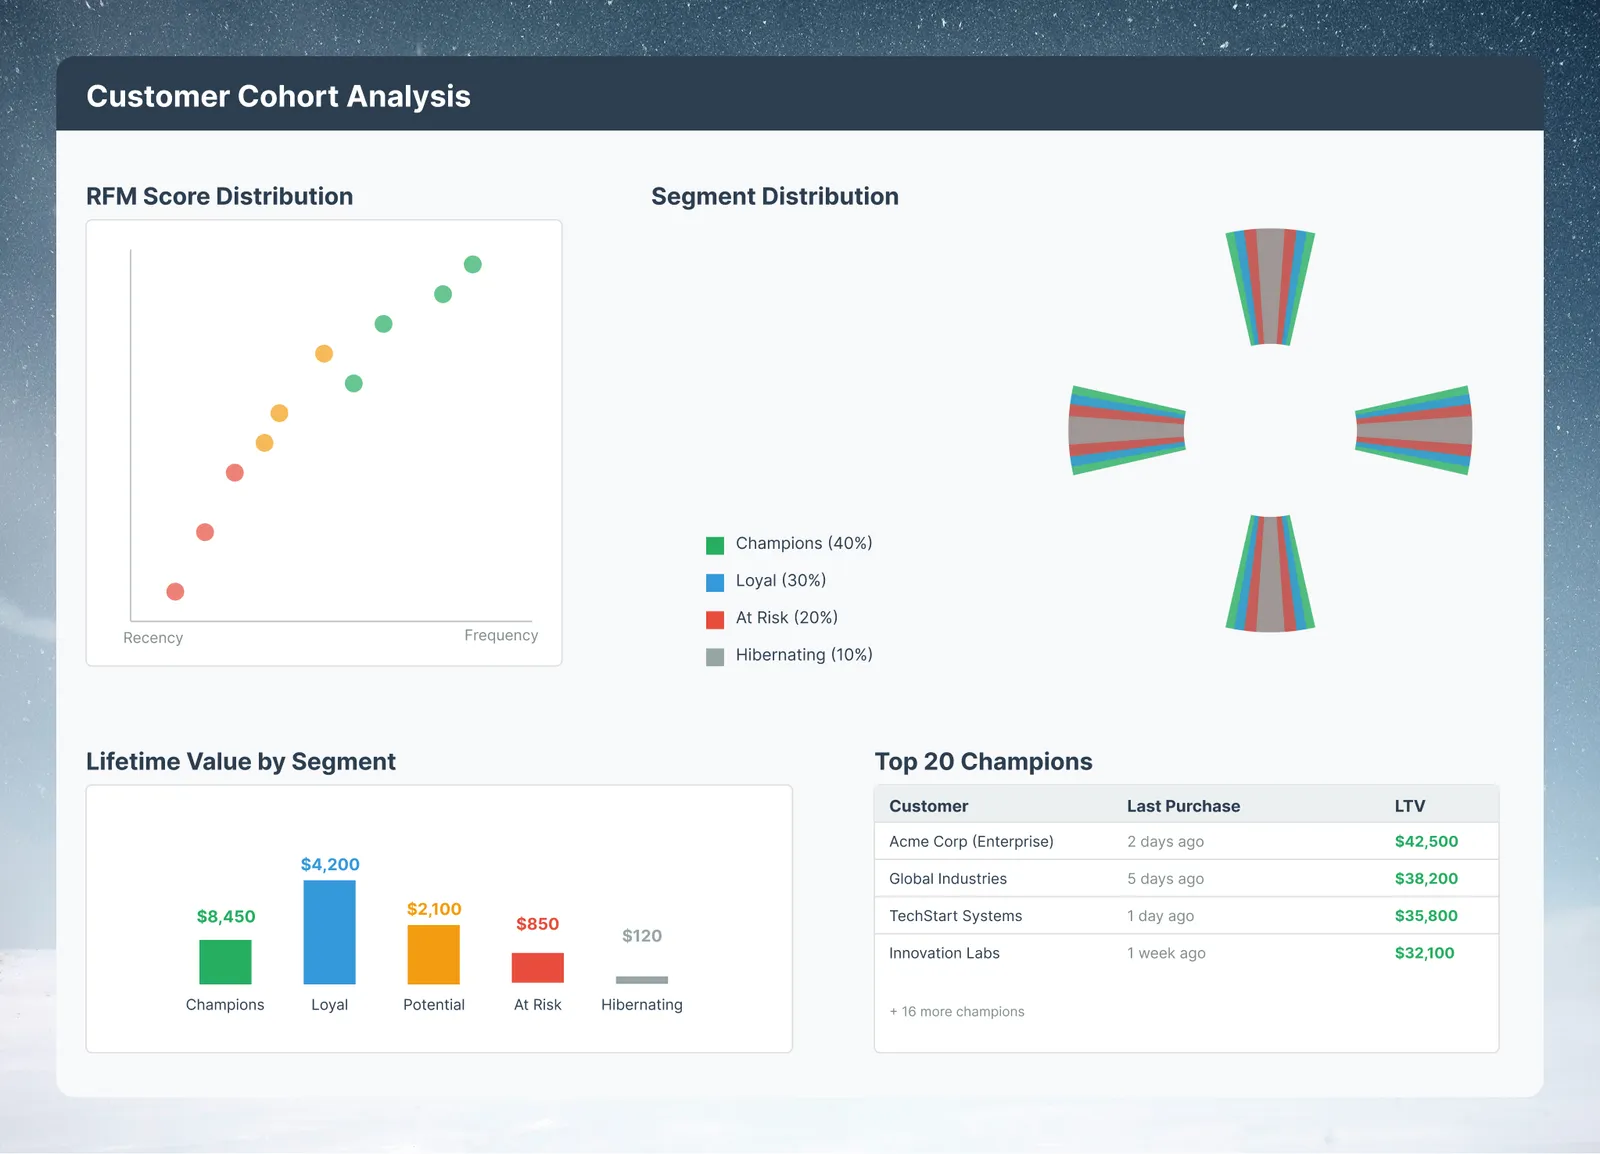
- Prompt: "Show customer segment distribution, LTV by segment, recency trend over time, and top 25 champions by total spend"
Recommended dashboard layout:
| Position | Card | Why |
|---|---|---|
| Top left | Segment distribution (pie or bar) | Quick health check |
| Top right | LTV by segment (bar chart) | Revenue concentration |
| Middle left | Champions table (top 25) | Actionable target list |
| Middle right | At Risk count and trend | Retention urgency |
| Bottom | Recency distribution (histogram) | Churn early warning |
Step 7: Export to CRM or email platform
Turn insights into action:
- Add a Conditional Filter to isolate a specific segment (e.g., "At Risk")
- Download as CSV, or use Send to destinations (for example, a database, SFTP, or REST API export) to hand the list to your CRM or marketing platform
- In Salesforce, create a campaign list from the At Risk segment; in HubSpot, trigger a re-engagement workflow
Results to expect
- Segment refresh: Configure a scheduled refresh, and segments recalculate automatically each time the pipeline runs
- Targeting: Export a segment as a list, or send it to a destination, for campaigns aimed at a specific group
Variations: retention curves and regional view
Cohort retention curves
Group customers by first-purchase month (acquisition cohort) and plot retention (the percentage still active) by month number. This shows whether your product has a retention problem and at which point customers typically churn.
Geographic segmentation overlay
After joining customer attributes, add a choropleth map card to the dashboard showing Champions density by region.