Data validation patterns
A dashboard that shows wrong numbers is worse than no dashboard. Validation patterns in Mammoth catch bad data before it reaches a consumer, either by halting the pipeline and alerting, or by flagging records so analysts know which rows to distrust. This guide is for data engineers, QA analysts, and operations managers. It covers gate and flag validation, Data Check tasks, financial reconciliation, quarantine Views, audit evidence, and pre-production testing.
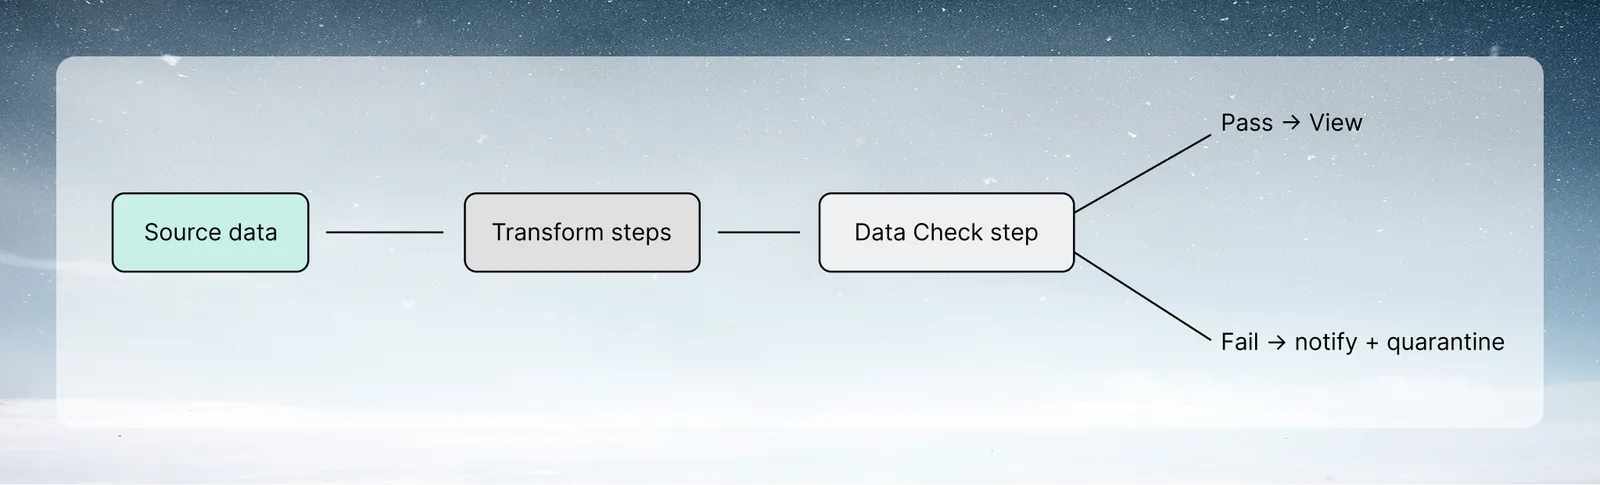
Two validation philosophies
Gate validation: the pipeline stops if data quality checks fail. Downstream consumers never see bad data because it never reaches them. The cost: analysts have no new data until the issue is resolved.
Flag validation: the pipeline continues, but each row has a quality flag (Valid, Warning, Invalid). Consumers see all data, and can filter by quality flag. The cost: analysts might accidentally include flagged rows in their analysis.
When to use which:
- Use gate validation for financial data, regulated reports, or any output where bad data could cause decisions or legal consequences
- Use flag validation for operational data where it's acceptable to analyze partial datasets, or when you want to surface data quality issues as a metric rather than a blocker
Gate validation with the Data Check task
The Data Check pipeline task is built for this. Add it directly to your pipeline rather than bolting checks onto the automation that runs it. A single Data Check task can configure multiple checks: row count, null percentage, value range, unique values, or a Custom prompt check (a rule you describe in plain language, which Mammoth turns into SQL), each with its own condition and tolerance. The task has one fail action: Flag and continue (the pipeline runs normally and the failure is flagged) or Pause the pipeline (gate validation: the pipeline stays paused until the data is fixed or approved). Use Notify on failure to pick recipients so a failure actually reaches someone.
Row count check
The simplest and most important check: does the output have a reasonable number of rows?
- Add a Data Check task after your transformation tasks
- Add a Row count check:
> 0(catches empty output from upstream failure) - For time-series data, use a tolerance-based row count check against the previous run to catch unexpected drops (e.g. more than 10% below the prior run)
Null rate check
For columns that must be populated, add a Null percentage check on that column directly in the Data Check step (for example, Amount null percentage < 5). You do not need to precompute the rate with separate tasks.
Range check
For numeric columns with known valid ranges, add a Value range check in the Data Check task (for example, Amount between 0 and 10000000). Set the fail action to Flag and continue to flag the failure for review, or Pause the pipeline if any out-of-range value should stop the pipeline.
Referential integrity check
Verify that foreign keys actually exist in the reference table:
- Lookup the foreign key against the reference table. Unmatched rows resolve to
NULLin the new lookup column - Add a Data Check task with a Custom prompt check verifying the count of unmatched rows is zero
Financial reconciliation pattern
For finance and accounting data, reconciliation is the cornerstone of data integrity: totals must match the source system at every transformation stage.
Control total pattern
- Extract the control total from the source system (total debits, total credits, row count), often available in a summary report
- After each major transformation stage, compute the same total in Mammoth
- Compare:
ControlTotal_Source = ControlTotal_After_Transform
Example for GL consolidation:
Source GL export: 47,832 rows, total debits = $4,823,441.20
After entity normalization: 47,832 rows, total debits = $4,823,441.20 ✓
After currency conversion: 47,832 rows, total debits = $4,823,441.20 ✓ (USD base)
After inter-company elimination: 46,204 rows, total = $4,318,220.15 ✓ (expected reduction)
Double-entry check
For double-entry accounting data:
- Group & Pivot:
SUM(Debits),SUM(Credits) - Math Function:
Imbalance = ABS(SUM(Debits) - SUM(Credits)) - Data Check task, Custom prompt check:
Imbalance < 0.01(allow for rounding but not structural imbalance), fail action Pause the pipeline
Period-over-period quick check
For monthly financial data, large unexpected swings are a data quality signal (not always, but always worth checking):
- Window function:
LAG(Total, 1)for previous period total - Math Function:
MoMChange = ABS(Total - PrevTotal) / PrevTotal * 100 - Flag rows where
MoMChange > 50for manual review. This is a quarantine flag, not a gate
Quarantine pattern
Instead of halting on bad data, route invalid rows to a separate dataset:
-
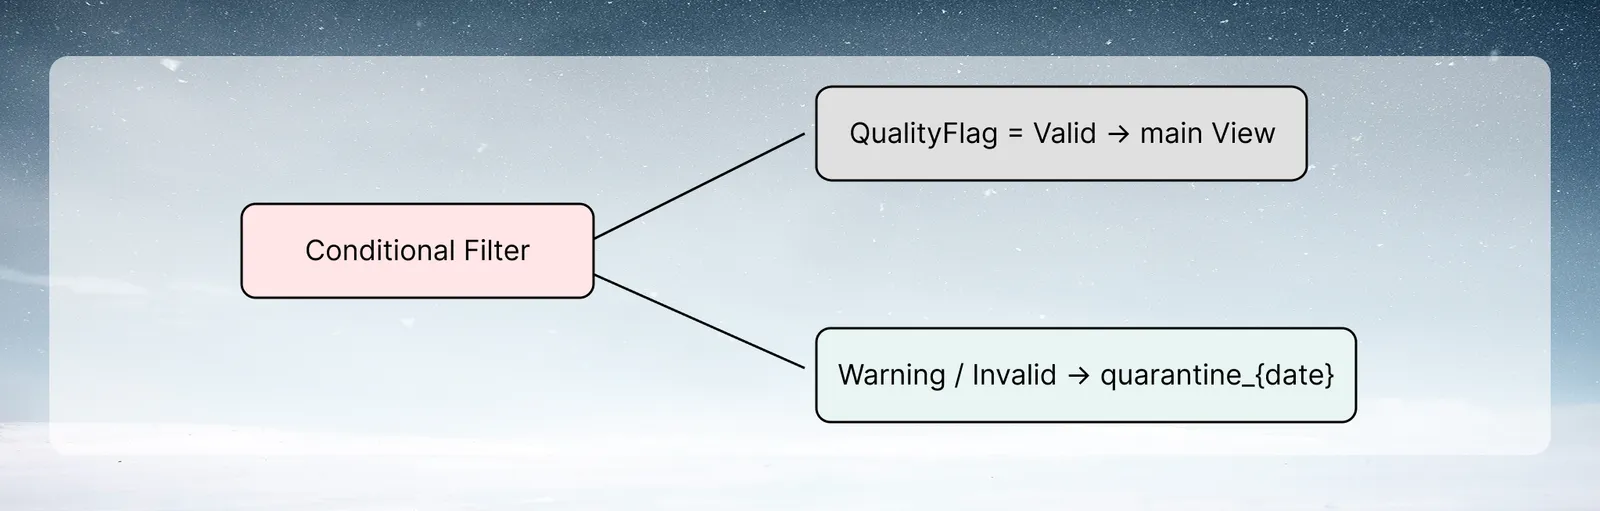
Create two Views on the same Dataset, each with its own Conditional Filter:
- Main View: keeps
QualityFlag = 'Valid'; this is the output consumers read - Quarantine View: keeps
QualityFlagofWarningorInvalid; export or retain it for review
- Main View: keeps
-
A data steward reviews the quarantine dataset and either:
- Fixes the source and reruns
- Manually corrects rows and re-merges to the main View
- Documents the issue and accepts the partial dataset
The quarantine pattern keeps the main View clean while preserving the bad data for investigation. "Quarantine" here is only a naming convention for the second View. Mammoth has no built-in quarantine mode.
Audit-ready pipeline design
For regulated environments (SOX, HIPAA, Basel III), validation must leave evidence:
Document every check
Every Data Check task should have a description that answers:
- What is being checked
- What the threshold is
- Why that threshold was chosen
- Who approved the threshold
Example: "Row count must be ≥ 44,000. Threshold based on minimum expected daily transaction volume from Finance SLA agreement (Jan 2025). Approved by Controller."
Preserve check results
- Each Data Check task shows its status (passed, failed, bypassed, or not run) and run details, including the result of every check, in the pipeline
- Mammoth does not write check results to a dataset for you. If your auditors need a historical record of actual values and thresholds, keep your own audit log (for example, a dataset you append to on each review)
- Export that audit log monthly as evidence for regulatory review
Activity Log as audit evidence
Mammoth's Activity Log captures every user action and every pipeline execution automatically. Exporting it requires an Enterprise plan. For SOX audits:
- Export the Activity Log for the relevant period
- The log shows: who triggered each pipeline and when. Pair it with your own audit log for the actual check results (values, pass/fail, thresholds), which the Activity Log does not record
- Together, these give you documented evidence of data preparation activities. Confirm with your auditors that this meets your requirements
Testing pipelines before production
Before making a new pipeline production:
- Test with synthetic edge cases: deliberately include rows with nulls, out-of-range values, and mismatched keys, and verify the validation catches them
- Test with last period's data: run the pipeline against the previous period where you know the expected output, and compare results
- Test failure paths: manually trigger a quality gate failure and verify the alert fires and the downstream View is not updated
Document the test results in the pipeline description with the date and outcome. This demonstrates due diligence for future audits.