Multi-source integration
The master data problem: five systems, each with authoritative data on a slice of your business, each with its own schema, naming conventions, and update cadence. The result is a mess of VLOOKUPs, manual reconciliation, and reports that do not agree.
This guide is for data engineers, integration specialists, and analysts. It shows how to build a single, authoritative master dataset in Mammoth that consolidates multiple sources, resolves conflicts, handles schema differences, and stays current automatically.
What you will build: A master dataset that ingests from multiple sources, normalizes schemas, deduplicates records, and refreshes on a configurable schedule.
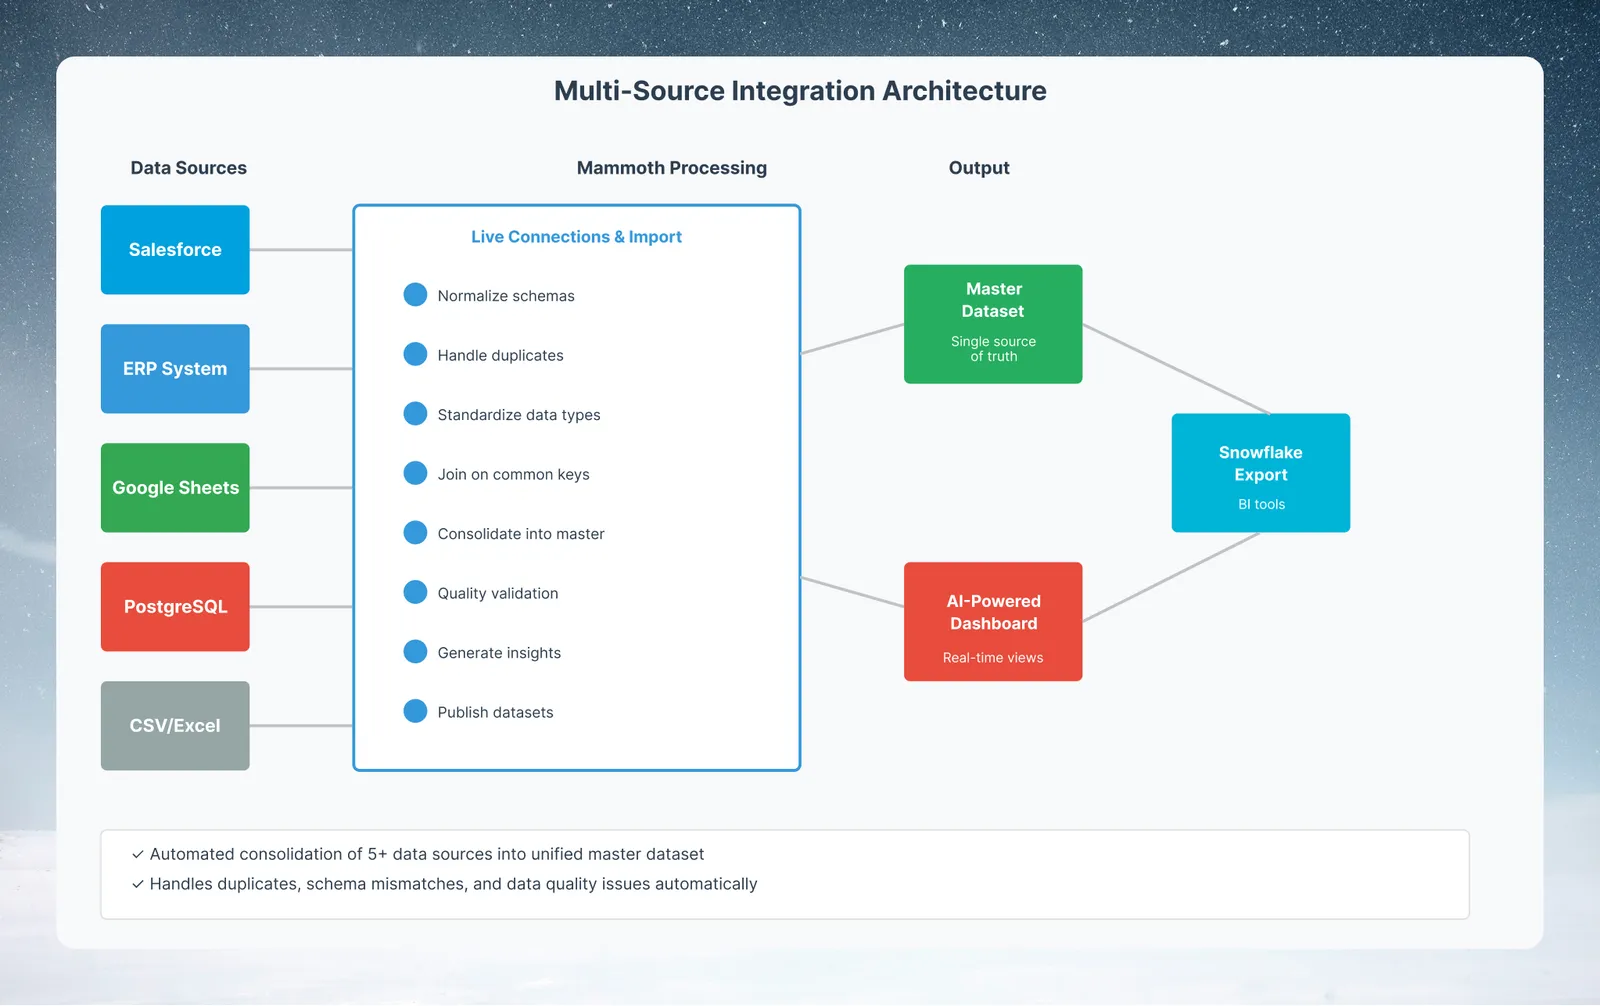
The challenge of integrating multiple sources
Multi-source integration problems compound:
- Source A uses
customer_id, Source B usesCustomerID, Source C usescust_no - The same company appears as "Acme Corp", "ACME", and "Acme Corporation" across sources
- Sources update at different cadences: CRM hourly, ERP daily, warehouse weekly
- Any single source can have gaps; the integrated view should fill from others
Step 1: Map your sources
Before building, document what you are consolidating. For each source:
| Source | Type | Key field | Update cadence | Schema notes |
|---|---|---|---|---|
| Salesforce CRM | Connector | AccountId | Scheduled refresh | Account.Name, Industry, Region |
| NetSuite ERP | File upload | Customer_Code | Daily export | Different region codes |
| Google Sheets | Connector | cust_id | Manual updates | Marketing team maintains |
| Warehouse DB | Connector | CUST_NO | Weekly | Most authoritative for revenue |
| Support tickets | Webhook or REST API connector | customer_id | As events arrive | Health score data |
This mapping is your integration contract. You will reference it throughout the build.
Step 2: Normalize each source
For each source, build a normalization pipeline that outputs a consistent schema.
Standard output schema:
customer_id_canonical   | string  : normalized unique identifier
company_name_canonical  | string  : deduplicated company name
region_canonical        | string  : standardized region (AMER/EMEA/APAC)
industry_canonical      | string  : standardized industry
source_system           | string  : which source this row came from
source_updated_at       | date    : when the source record was last updated
Normalize Salesforce:
- Connect Salesforce Account data via + New Dataset → Connectors → Salesforce
- Transform:
- Use Rename Column in each column's menu to match the standard schema:
AccountId→customer_id_canonical,Name→company_name_canonical - Bulk Replace on
Regionto normalize to AMER/EMEA/APAC - Add column
source_system, then Label & Insert Values with the constant valuesalesforce
- Use Rename Column in each column's menu to match the standard schema:
Repeat this normalization pattern for each source, producing one dataset per source with identical schemas.
Step 3: Deduplicate company names
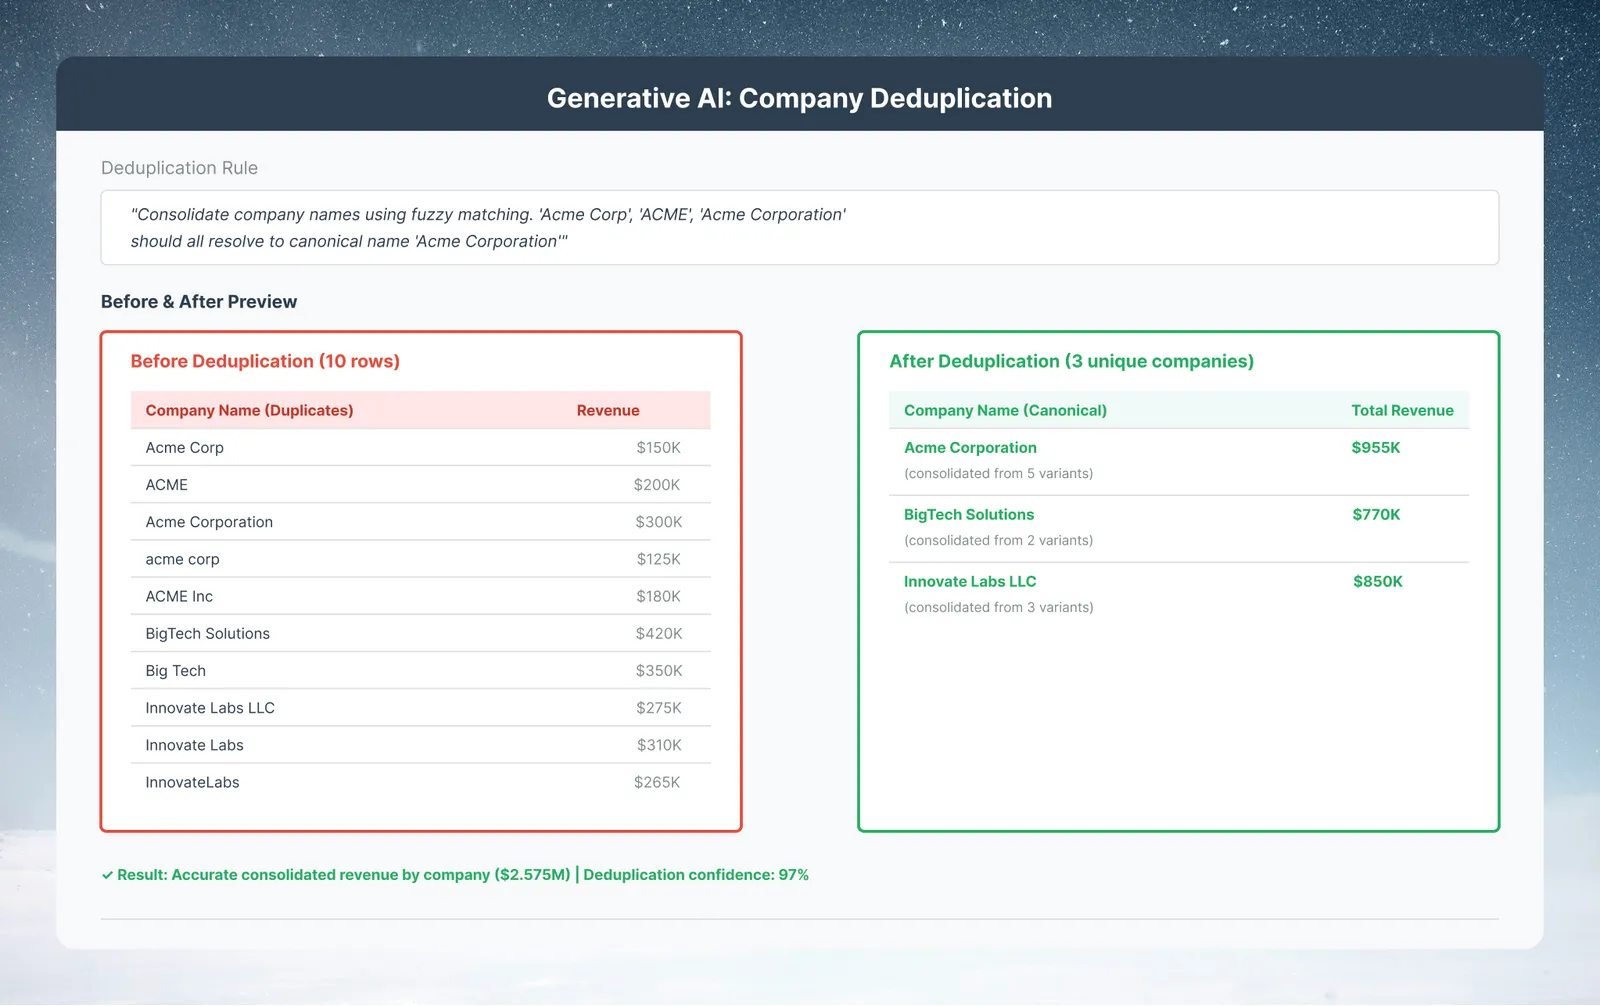
The hardest part of master data: "Acme Corp" and "ACME Corporation" are the same company.
- Combine all normalized datasets into one (see Step 4 for the pattern)
- On the consolidated dataset, add a Generative AI task
- Describe: "Standardize the company_name_canonical column. Consolidate variations of the same company into a single canonical form. Use the most complete or official version (for example, prefer 'Acme Corporation' over 'ACME' or 'Acme Corp')."
- Select
company_name_canonicalas the context column and preview the output - Review the output: spot check a sample of rows, and correct any mismatches using Bulk Replace
Tip: Generative AI row limit
Generative AI processes only the first 50,000 rows of a view and writes at most 300 characters per value. For larger datasets, deduplicate in stages, or use Bulk Replace, which groups the unique values of a column for you.
Step 4: Consolidate with priority rules
Append all normalized sources, then apply priority rules where sources conflict.
Consolidate all sources
- Open your first normalized dataset (e.g., Salesforce)
- In each additional source's pipeline, add a Send to dataset task (Unify) pointing to the consolidated dataset, with Update Method Combine data
- Result: all rows from all sources, one per record per source, in a single consolidated dataset
Resolve conflicts with priority rules
When the same company appears in multiple sources with different values, you need a rule for which source wins.
- Decide which source owns each field:
revenue: the warehouse DB (most authoritative)region: Salesforceindustry: Salesforcehealth_score: Support tickets
- Create one View per owning source using a Conditional Filter on
source_system(for example,source_systemiswarehouse_db) - Starting from a View with one row per
customer_id_canonical(use Remove duplicate rows), bring in each field from its owning source's View with Lookup (one value) or Join (several columns) oncustomer_id_canonical
Step 5: Add a freshness indicator
Track which sources contributed to each master record and when they last updated.
- Add a Calculate date difference task: Start Date
source_updated_at, End Date Current Time (UTC), unit Days, new columnDaysSinceUpdate - Add an AI SQL Query task: "Add a FreshnessStatus column: 'Stale' if DaysSinceUpdate is greater than 7, otherwise 'Current'"
- This becomes your master data freshness dashboard
Step 6: Set up multi-source refresh automation
Each source updates on a different schedule. Set up refreshes for each:
- Open Automations in the project sidebar → New Automation
- Create Dataset Refresh automations for each connector source (Salesforce, Google Sheets, the warehouse DB)
- Stagger the schedules, for example Salesforce at 5 AM and the warehouse at 5:30 AM, so the sources are current when downstream tasks run
- A Send to dataset task runs whenever its pipeline runs, so the consolidated dataset updates as each source refreshes. Automations cannot yet wait on one another, so allow enough time between schedules
Step 7: Send the master dataset to downstream destinations
- Open your master dataset's View in the Data Editor
- Use Export to add a destination
- Options:
- Export → Databases → BigQuery, PostgreSQL, SQL Server, or Redshift: push the master dataset to your data warehouse
- Live Link: an auto-updating URL for BI tools (Tableau, Power BI) or lightweight consumers
- Export → Tableau Server/Cloud, SFTP, or REST API Export for other downstream systems
Results to expect
- One authoritative master dataset replaces several separate reports
- Source and update date are tracked on every record
- Business teams can read the master dataset or its dashboards without maintaining the reconciliation themselves
Variations: schema drift and golden records
Handle schema drift
When Source A adds a new column, your normalization pipeline silently excludes it (it is not in the standard schema). Mammoth pauses the update and prompts you when a refresh or new file looks different from what you saved, so review the new columns and update your standard-schema mapping.
Golden record pattern
For true MDM (master data management), the "source wins" priority rule is not enough. Build a golden record by scoring each source field's completeness and recency, then taking the highest-scoring value regardless of source.