Python/pandas comparison
This guide is for Python developers evaluating Mammoth. It compares visual pipeline development with code-based data manipulation in pandas, shows how common pandas operations map to Mammoth tasks, and describes how the two can work together.
Key takeaways:
- Different strengths: pandas for custom algorithms, Mammoth for data preparation
- Step preview: Mammoth previews each task as you build it
- Team collaboration: Business users can build and maintain pipelines without code
- Hybrid approach: Use both tools for the parts each handles best
Philosophy differences
Python/pandas approach
- Code-first: Write scripts to transform data
- Technical focus: Requires programming knowledge
- Flexible: Custom logic through code
- Version control: Scripts tracked in git
Mammoth approach
- Visual-first: Build pipelines through interface
- Business logic focus: Accessible to non-programmers
- Guided: A library of transformation tasks with preview
- Collaborative: Share pipelines without code execution
Both approaches transform data. They serve different users and use cases.
When to use each tool
Python/pandas better for
Custom algorithms
# Complex statistical calculations
def calculate_customer_lifetime_value(df):
    # Custom CLV algorithm with multiple parameters
    return df.groupby('customer_id').apply(custom_clv_logic)
Machine learning integration
- Model training and evaluation
- Feature engineering with scikit-learn
- Statistical analysis requiring specialized libraries
- Integration with TensorFlow, PyTorch
Advanced statistical analysis
- Hypothesis testing
- Time series modeling
- Custom aggregations requiring complex logic
Mammoth better for
Business-user self-service
- Non-technical team members can build pipelines
- No programming required
- Visual documentation (pipeline diagrams)
Rapid data preparation
- Step-by-step preview, plus Draft mode for iterating on a pipeline
- AI-assisted step generation from the AI Prompt bar
Team collaboration
- Share pipelines without requiring code execution environment
- Business users can modify and maintain workflows
- Built-in data profiling and quality assessment
Production data operations
- Automated scheduling through Automations
- Connectors to databases, APIs, and cloud storage
- Pipeline health and Data Check steps for monitoring
Tip: Consider a hybrid approach
Use Mammoth for data preparation (cleaning, joining, aggregating) and Python for advanced analytics (modeling, statistical analysis). Export clean data from Mammoth to CSV or database, then analyze with your Python tools.
Feature-by-feature comparison
Data loading
Pandas:
# Multiple formats and sources
df = pd.read_csv('sales.csv')
df = pd.read_excel('sales.xlsx', sheet_name='Q1')
df = pd.read_sql("SELECT * FROM orders", connection)
df = pd.read_json('api_response.json')
Mammoth equivalent:
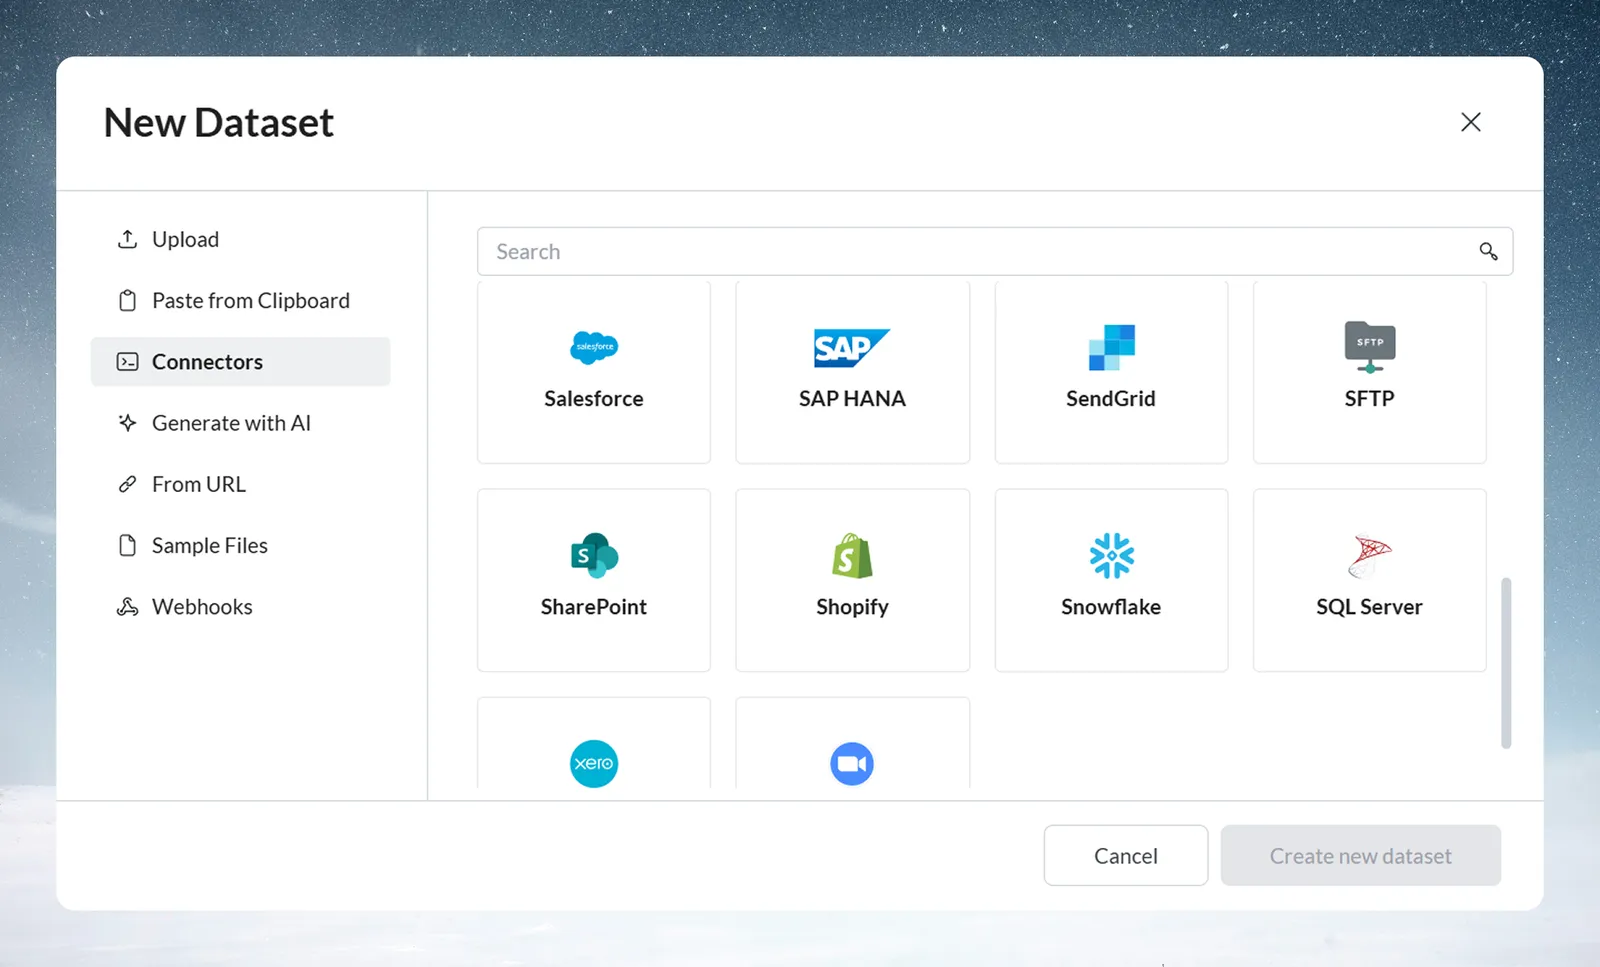
- File upload for common file formats such as CSV and Excel
- Connectors for databases, APIs, and cloud storage
Winner: Mammoth for ease of use, Pandas for programmatic control
Data filtering
Pandas:
# Single and multiple conditions
df = df[df['status'] == 'active']
df = df[(df['amount'] > 100) & (df['date'] > '2024-01-01')]
df = df[df['category'].isin(['A', 'B', 'C'])]
df = df[~df['email'].isna()]
Mammoth equivalent:
- Conditional Filter transformation
- Visual condition builder (no syntax errors)
- Multiple conditions
- Preview shows exactly which rows will be kept/removed
Winner: Pandas for complex conditions, Mammoth for business user accessibility
Column operations
Pandas:
# Selection, calculation, combination
df = df[['name', 'amount', 'date']]
df['total'] = df['price'] * df['quantity']
df['full_name'] = df['first_name'] + ' ' + df['last_name']
df['profit_margin'] = (df['revenue'] - df['cost']) / df['revenue']
df = df.drop(['temp_col'], axis=1)
Mammoth equivalent:
- Remove Column transformation
- Math function (arithmetic on columns, with preview)
- Combine columns & text (concatenation with separators)
- Add Column
- All with visual configuration panels
Winner: Similar capabilities, Pandas more flexible, Mammoth more accessible
Data type conversion
Pandas:
# Type conversion with error handling
df['date'] = pd.to_datetime(df['date'], errors='coerce')
df['amount'] = pd.to_numeric(df['amount'], errors='coerce')
df['category'] = df['category'].astype('category')
Mammoth equivalent:
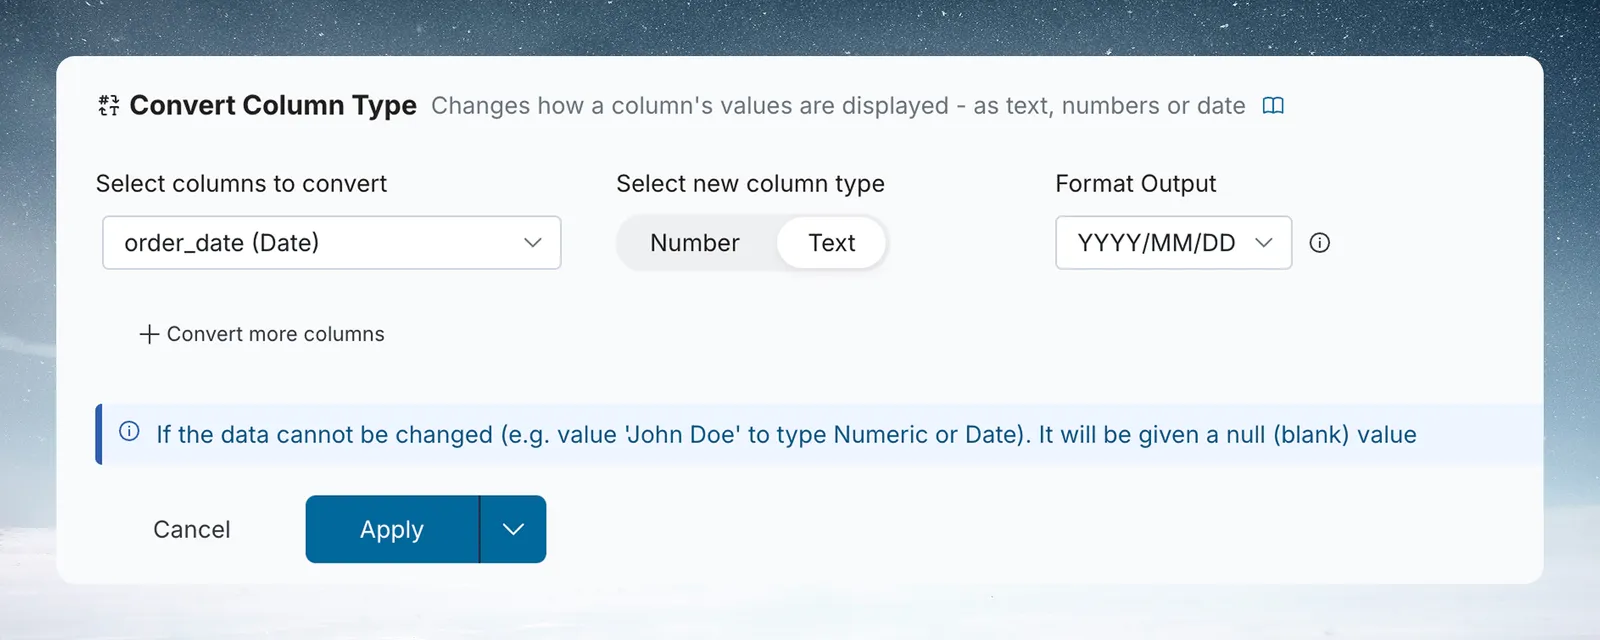
- Convert Column Type transformation
- Date format selection
- Visual type indicators in data grid
- Preview conversion results before applying
Winner: Mammoth for ease of use and error prevention
Aggregations and group by
Pandas:
# Complex aggregations
summary = df.groupby(['region', 'category']).agg({
    'sales': ['sum', 'mean'],
    'orders': 'count',
    'customers': 'nunique'
}).reset_index()

# Time-based grouping
monthly = df.groupby(pd.Grouper(key='date', freq='M')).sum()
Mammoth equivalent:
- Group & Pivot transformation
- Aggregations such as Sum, Average, Min, Max, Std Dev, Count, and Distinct count
- Visual grouping interface with column selection
Winner: Pandas for complex custom aggregations, Mammoth for standard business aggregations
Joins and merges
Pandas:
# Various join types
result = pd.merge(df1, df2, on='customer_id', how='left')
result = df1.join(df2.set_index('key'), on='key', how='inner')

# Multiple key joins
result = pd.merge(df1, df2,
                  left_on=['date', 'store'],
                  right_on=['order_date', 'location'])
Mammoth equivalent:
- Join transformation (Left, Right, Inner, Outer)
- Lookup transformation (pull one column from another view by key)
- Visual join key selection
Winner: Similar capabilities for common joins; Pandas for unusual join logic
String operations
Pandas:
# String manipulation
df['clean_name'] = df['name'].str.strip().str.upper()
df['domain'] = df['email'].str.extract(r'@(.*)')
df['area_code'] = df['phone'].str[:3]
df['standardized'] = df['company'].str.replace('Corp.', 'Corporation')
Mammoth equivalent:
- Text Formatting (upper, lower, proper case, trim)
- Extract Text (describe the pattern in plain language, or configure it directly)
- Find & Replace (pattern matching and substitution)
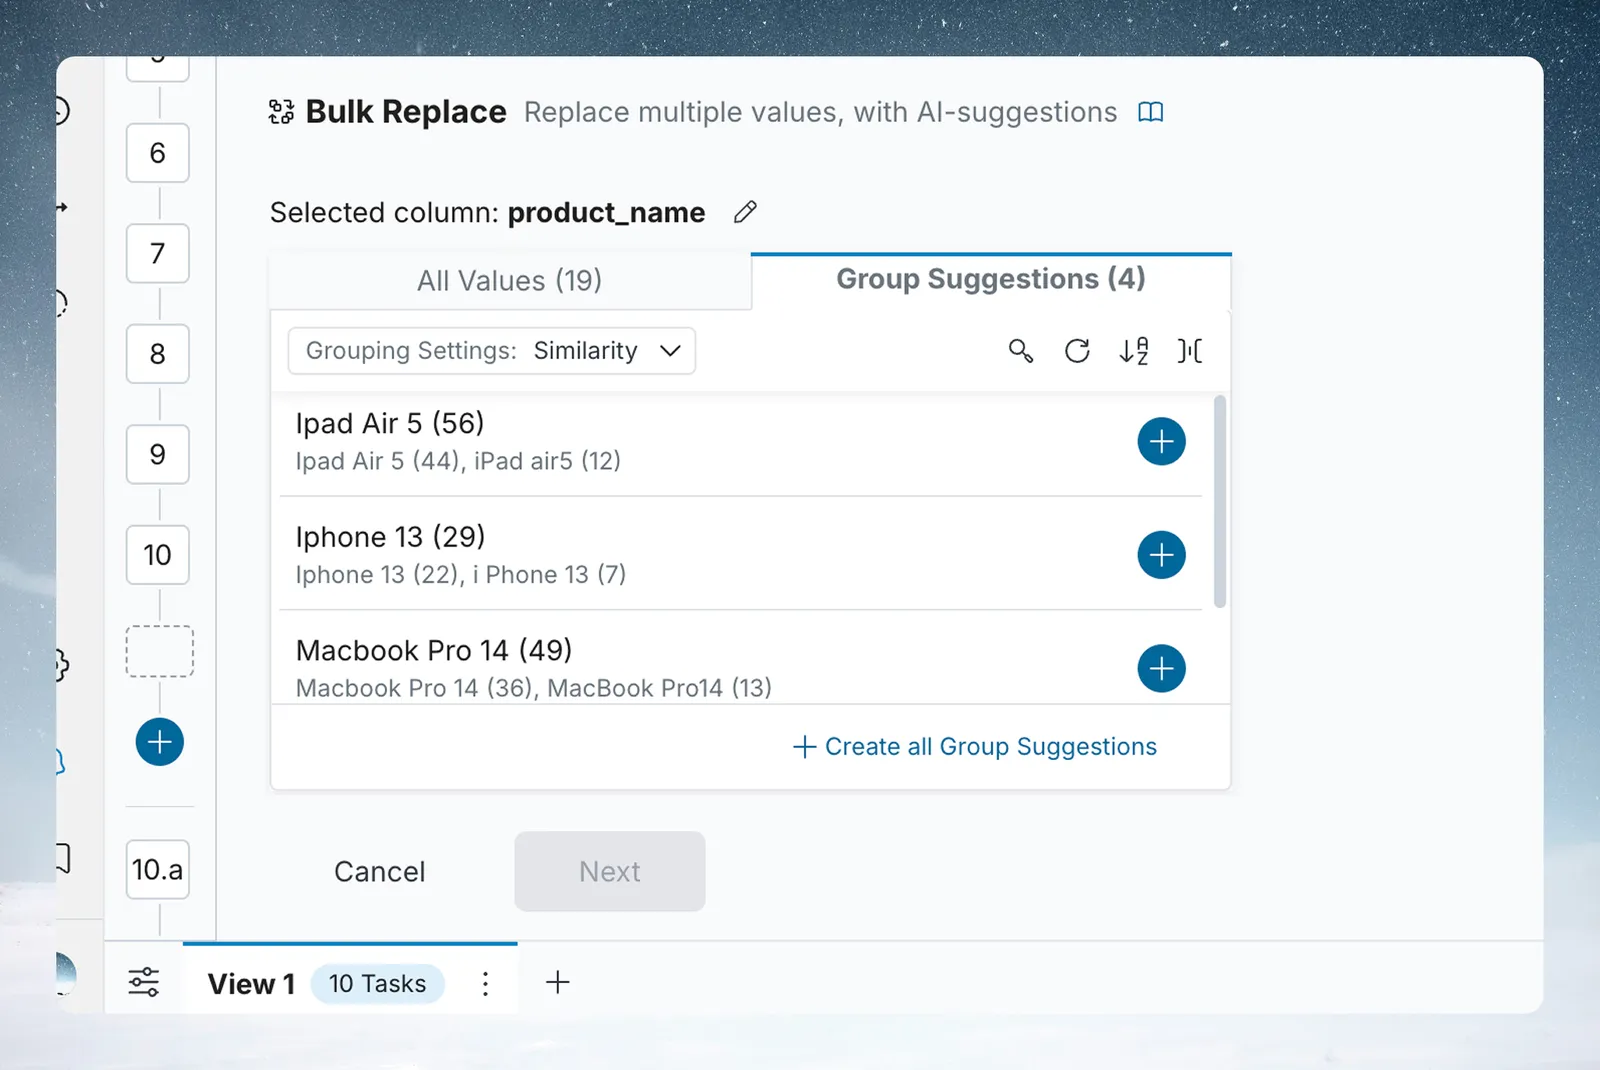
- Bulk Replace (many-to-one mappings with AI-suggested groups)
Winner: Pandas for complex regex, Mammoth for business-friendly text operations
Performance comparison
Processing scale
Pandas: Limited by local machine memory and CPU.
Mammoth: Processing runs on Mammoth's cloud infrastructure, so it does not depend on your machine's memory. Benchmark both tools on your own data before deciding.
Development cycle
Pandas: Write code, run it, debug, test with different data, then document and review.
Mammoth: Configure each step visually, preview the result, and adjust. Each task documents itself in the pipeline.
Winner: Mammoth for data preparation tasks, Pandas for complex custom logic
Tip: Use Draft mode
Use Draft mode in Mammoth to try changes to a pipeline before committing them.
Team collaboration comparison
Code-based collaboration (pandas)
Advantages:
- Version control through git
- Code review processes
- Reproducible analysis (run script anywhere)
- Documentation through comments and docstrings
Challenges:
- Requires Python knowledge across entire team
- Onboarding requires Python skills
- Debugging requires technical troubleshooting skills
- Sharing requires Python environment setup
Visual-based collaboration (Mammoth)
Advantages:
- Business users build pipelines without coding
- Visual pipeline serves as documentation
- New team members don't need to learn a programming language
- Instant sharing through Published Views and dashboards
- Built-in data profiling accessible to everyone
Challenges:
- Pipeline logic is not kept in a code repository; use pipeline version history to restore earlier versions (available on some plans)
- Limited to platform's transformation capabilities
- Custom algorithms require API integration or export
Real-world migration example
This example builds the same data pipeline in both approaches.
Scenario: Sales performance analysis
Goal: Combine customer data with sales transactions, clean the data, and create monthly summaries by region.
Pandas implementation
import pandas as pd
import numpy as np
from datetime import datetime

def process_sales_data():
    # Load data from multiple sources
    customers = pd.read_sql("""
        SELECT customer_id, name, email, region, segment
        FROM customers
        WHERE active = 1
    """, crm_connection)

    transactions = pd.read_csv('sales_transactions.csv')

    # Clean and standardize
    customers['email'] = customers['email'].str.lower().str.strip()
    customers['name'] = customers['name'].str.title()

    # Convert dates and handle errors
    transactions['date'] = pd.to_datetime(
        transactions['date'],
        errors='coerce'
    )
    transactions = transactions.dropna(subset=['date'])

    # Calculate derived fields
    transactions['total_amount'] = (
        transactions['price'] * transactions['quantity']
    )

    # Join datasets
    merged = pd.merge(
        transactions,
        customers[['customer_id', 'name', 'region', 'segment']],
        on='customer_id',
        how='left'
    )

    # Create monthly summaries
    monthly_summary = merged.groupby([
        'region',
        pd.Grouper(key='date', freq='M')
    ]).agg({
        'total_amount': 'sum',
        'transaction_id': 'count',
        'customer_id': 'nunique'
    }).reset_index()

    # Rename columns for clarity
    monthly_summary.columns = [
        'region', 'month', 'total_revenue',
        'transaction_count', 'unique_customers'
    ]

    # Export results
    monthly_summary.to_excel(
        f'sales_summary_{datetime.now().strftime("%Y%m%d")}.xlsx',
        index=False
    )

    return monthly_summary

# Execute
result = process_sales_data()
print(f"Processed {len(result)} monthly summaries")
Lines of code: about 50
Mammoth implementation
Pipeline tasks:
- Connector: CRM database (customers table)
- File upload: sales_transactions.csv
- Text Formatting: Email to lowercase, Name to proper case
- Convert Column Type: Date column
- Conditional Filter: Remove rows with invalid dates
- Math Function: total_amount = price × quantity
- Join: Transactions LEFT JOIN Customers on customer_id
- Group & Pivot: Group by region + month, aggregate sum/count/distinct
- Export: Download the View as XLSX, or send it to a destination
Pipeline length: 9 tasks
Migration strategies
Gradual migration approach
Phase 1: Identify use cases
- Keep in Pandas: Custom algorithms, ML model development, statistical analysis
- Move to Mammoth: Data cleaning, joining, standard aggregations, reporting prep
- Hybrid workflows: Mammoth prep → export → Pandas analysis
Phase 2: Parallel operation
- Maintain existing Pandas scripts initially
- Rebuild data preparation portions in Mammoth
- Validate outputs match between both approaches
- Train team on visual pipeline development
Phase 3: Integration points
- Mammoth Live Links → Pandas read_csv()
- Python analysis results → Database → Mammoth connector
- API integration for programmatic pipeline control
- Scheduled Automations for production workflows
Tip: Start with repetitive tasks
Begin with your most repetitive data preparation tasks. They are the easiest to validate against your existing scripts.
Common translation patterns
| pandas pattern | Mammoth equivalent | Notes |
|---|---|---|
df.groupby().agg() | Group & Pivot | Multiple aggregation functions supported |
pd.merge() | Join transformation | Visual join key selection |
str.extract() | Extract Text | Describe the pattern in plain language, or configure it directly |
fillna() | Fill Missing Values | Fill from above or below, or Smart fill (no constant value) |
pivot_table() | Group & Pivot | Cross-tabulation with preview |
df[condition] | Conditional Filter | Visual condition builder |
pd.to_datetime() | Convert Column Type | Pick the date format |
Hybrid workflow patterns
Pattern 1: Data prep → advanced analytics
# 1. Mammoth handles data preparation
#    (visual pipeline: clean, join, aggregate)

# 2. Python handles advanced analytics
import pandas as pd
from sklearn.cluster import KMeans

# Load clean data from Mammoth
df = pd.read_csv('mammoth_output.csv')

# Advanced analysis requiring specialized libraries
model = KMeans(n_clusters=5)
df['customer_segment'] = model.fit_predict(df[['recency', 'frequency', 'monetary']])

# Statistical analysis
correlation_matrix = df.corr()
significance_test = stats.chi2_contingency(contingency_table)
Pattern 2: Model development → production deployment
# 1. Python for model development and validation
model = train_customer_churn_model(historical_data)
accuracy = validate_model(model, test_data)

# 2. Mammoth for production scoring pipeline
#    - Connector to the customer database
#    - Feature engineering pipeline
#    - Scoring rules expressed with AI SQL Query (Mammoth does not run Python models)
#    - Export predictions to a database destination
Pattern 3: API integration
Trigger a Mammoth automation from Python with the mammoth-io SDK, wait for the view's pipeline, then read the prepared rows back for analysis:
import asyncio
import os

from mammoth import (
    AutomationPatchItem,
    AutomationPatchOp,
    AutomationPatchPath,
    MammothClient,
)


async def main():
    async with MammothClient(
        api_token=os.environ["MAMMOTH_API_TOKEN"],
    ) as client:
        client.set_project_id(10)

        # Run the automation that refreshes the pipeline
        await client.automations.update(
            42,
            [AutomationPatchItem(op=AutomationPatchOp.COMMAND, path=AutomationPatchPath.RUN, value={})],
        )

        # Wait for the view's pipeline to finish
        await client.pipeline.wait_for_pipeline(dataview_id=1039, dataset_id=7)

        # Read the prepared rows and continue the analysis in Python
        return await client.dataviews.get_data(dataset_id=7, dataview_id=1039)


result = asyncio.run(main())
For setup details, see the Python SDK reference and Authentication.
Making the decision
Choose Mammoth when
- Team includes non-technical users who need data access
- Spending much of your time on data cleaning and preparation
- Need rapid iteration and experimentation (Draft mode)
- Require business user self-service capabilities
- Want visual documentation of transformation logic
- Need built-in scheduling
Choose pandas when
- Building custom algorithms or statistical models
- Need full flexibility for complex transformations
- Working primarily with data scientists and engineers
- Require integration with specialized Python libraries
- Have existing code base that works well
- Need version control of transformation logic
Choose both when
- Large team with mixed technical skills
- Need both rapid data prep AND advanced analytics
- Want business users to build pipelines while engineers keep code-based control
- Have complex workflows spanning multiple tools
Tip: This is not either/or
You can use Mammoth for data preparation and Python for advanced analytics. The API and Python SDK support hybrid workflows.
Migration steps: evaluate, pilot, roll out
Step 1: Evaluation
- Identify your most time-consuming data preparation tasks
- Build one pipeline in Mammoth using sample data
- Compare development time and ease of maintenance
- Evaluate team member accessibility
Step 2: Pilot project
- Choose a representative data workflow
- Build parallel implementations (keep Pandas, add Mammoth)
- Validate outputs match exactly
- Train team members on visual pipeline development
- Measure time savings and team adoption
Step 3: Gradual rollout
- Migrate high-value, repetitive data preparation tasks
- Establish hybrid workflow patterns
- Create pipeline templates for common operations
- Build team expertise and best practices
- Integrate with existing Python analytics workflows
The goal is not to replace all your Python work. Use Mammoth for accessible, collaborative data preparation and Python for advanced analytics and custom algorithms.