Sales analytics use case
Every sales team has the same problem: reports that take hours to prepare manually and are already stale by the time they are shared. This guide is for sales operations and revenue analysts. It walks through building an automated sales reporting pipeline in Mammoth, from raw CRM data to a shareable dashboard.
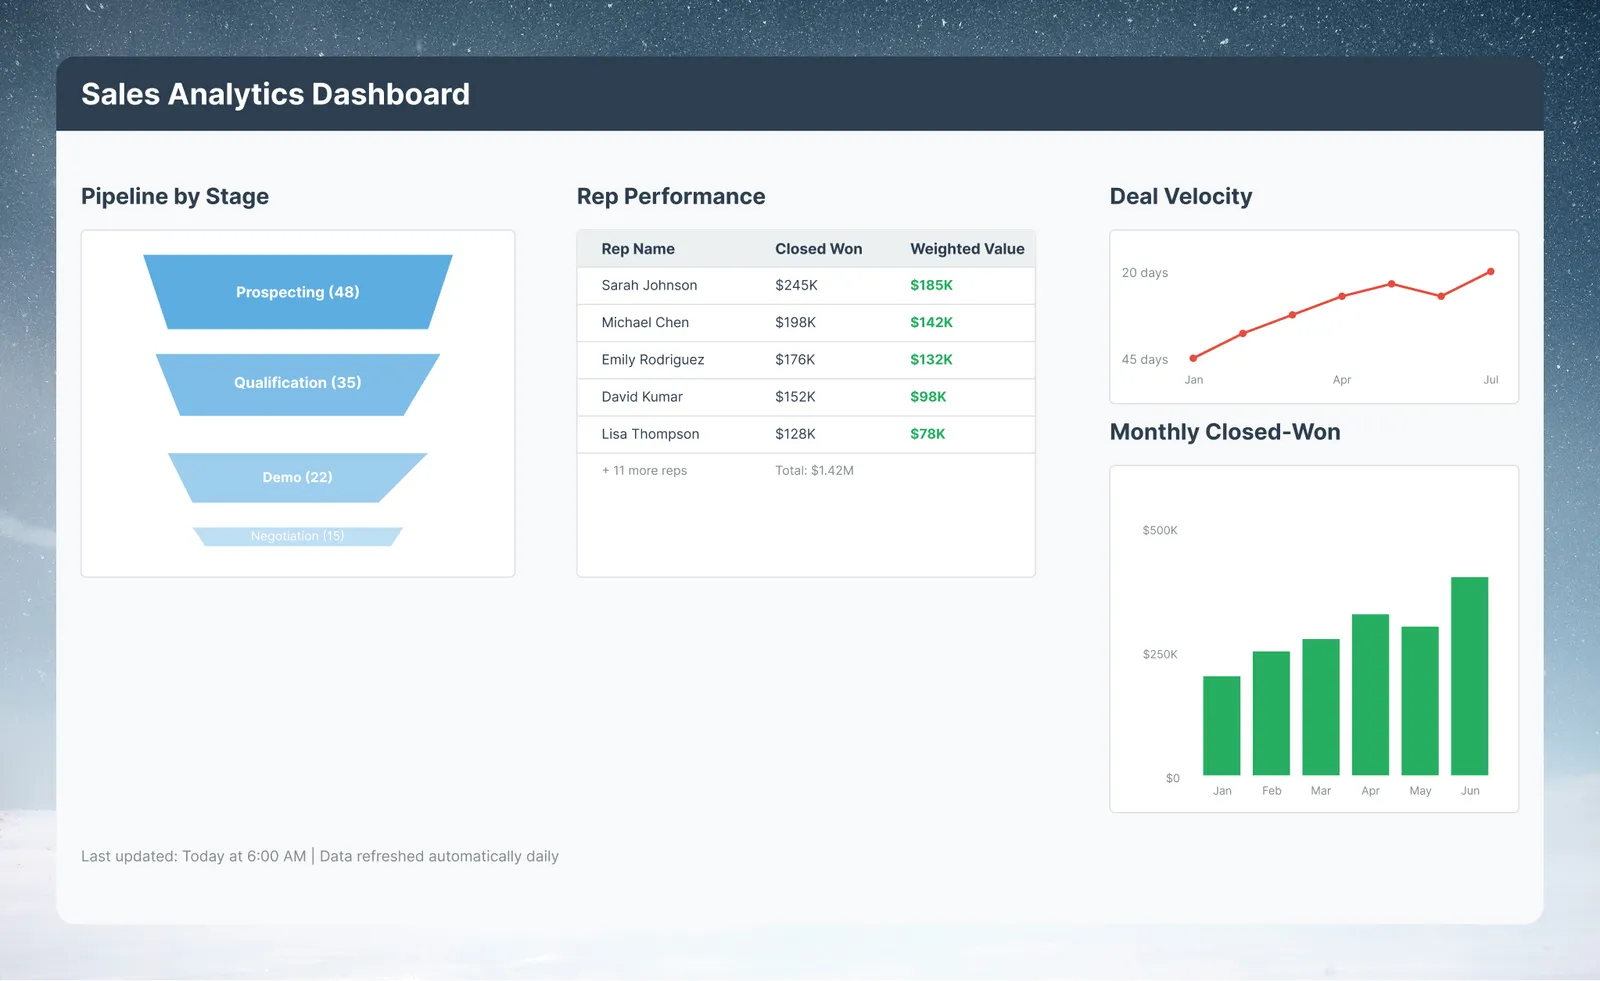
What you will build: A scheduled pipeline that pulls Salesforce opportunity data, cleans and transforms it, and powers a dashboard showing pipeline by stage, rep performance, and deal velocity.
The challenge of manual sales reporting
A typical enterprise sales operations setup looks like this:
- Sales data lives in Salesforce (or HubSpot, Dynamics, etc.)
- A RevOps analyst manually exports CSVs each Monday morning
- They spend a long time cleaning the export in Excel (fixing null values, standardizing stage names, calculating pipeline velocity)
- The resulting report is emailed out hours after the data was current
In Mammoth, every step after "data lives in Salesforce" is automated.
Requirements
- Mammoth workspace with at least one project
- A Salesforce account with API access (see Salesforce connector setup)
- The Opportunity and User objects visible to the Salesforce user you connect with
- Destination: Mammoth dashboard, or a downstream BI tool such as Tableau or Power BI (via a Live Link or database export)
Step 1: Connect to Salesforce
Connect Salesforce to Mammoth with the Salesforce connector.
- In your project, go to Data Library and click + New Dataset → Connectors
- Select Salesforce from the connector list
- Enter your instance URL, click Connect, and authorize Mammoth in Salesforce
- Select the Opportunity object and include:
Id,Name,StageName,Amount,CloseDate,OwnerId,CreatedDate,LastModifiedDate,Probability - Import the data. Mammoth creates a dataset from your current opportunities
Tip: Include LastModifiedDate
PullLastModifiedDateeven if you do not need it now. You need it for incremental refresh later.
Step 2: Clean the data
Raw Salesforce exports need cleaning before they're useful for reporting. Common issues:
Fix stage name inconsistencies. Salesforce often accumulates legacy stage names from previous sales processes.
- Open your dataset in the Data Editor and click + in the pipeline panel
- Choose Filter, Label & Replace → Bulk Replace and select the
StageNamecolumn - Use the AI-suggested groupings to map legacy values to current ones (e.g., "Qualification", "Qualify", "Qualifying" → "Qualification")
- Click Apply
Handle null amounts
- Add a Label & Insert Values task, enter
0, choose Some cells, and add the conditionAmountis empty - Place the value in the existing
Amountcolumn - Note in the pipeline description that a null amount means an unquoted opportunity
Standardize the date range
- Add a Conditional Filter task:
CloseDate→ is after → a fixed cutoff date - This scopes the dataset to the period you report on, keeping the pipeline fast. The filter compares against a fixed value, so update the cutoff date when the window needs to move
Step 3: Add calculated fields
Add three derived columns to the pipeline:
Days open
- Add a Calculate date difference task (under Date, Numeric & Text)
- Set Start Date to
CreatedDate, End Date to Current Time (UTC), and the unit to Days - Name the new column
DaysOpen
Pipeline tier
- Add an AI SQL Query task
- Describe the rule: "Add a PipelineTier column: Small if Amount is under $10K, Mid from $10K to $100K, Large above $100K"
- Review the generated SQL, then apply it
Weighted pipeline value
- Add a Math function task
- Formula:
"Amount" * ("Probability" / 100) - Name the new column
WeightedValue
Step 4: Build the dashboard
- From your cleaned View, click Create Dashboard
- On the prompt screen, type: "Show pipeline by stage, rep performance by closed-won amount this quarter, and deal velocity by month"
- Mammoth generates the initial dashboard and opens it in the editor
- Refine individual cards by continuing the conversation in the Dashboard Assistant
Key cards to include:
| Card | Chart type | Data |
|---|---|---|
| Pipeline by stage | Funnel or bar | Count and amount by StageName |
| Rep performance | Table | OwnerId, Count, WeightedValue, Won |
| Deal velocity | Line chart | Average days to close by month |
| Monthly closed-won | Bar chart | Sum of Amount where Stage = Closed Won |
Step 5: Schedule automated refresh
- Open Automations in the project sidebar and click New Automation → Dataset Refresh
- Select your Salesforce dataset as the source
- Set a daily schedule early in the morning (so data is ready before the business day starts)
- Name the automation, review the settings, and save
- Check the automation's status in the list after the first scheduled run
Your pipeline now refreshes automatically on that schedule, and the dashboard reflects the latest CRM data after each run.
Step 6: Share the dashboard
- Open your dashboard → click Publish & Share (top right)
- Set the Access Type:
- Authenticated: viewers must sign in to Mammoth. Use for internal stakeholders who have workspace access.
- Public: anyone with the link can view without signing in. Use for executives, external partners, or embedded portals.
- Toggle the status to Published
- Copy the link and share in your Slack sales channel or weekly email
Tip: Email the View on a schedule
Use a Messaging automation (Automations → New Automation → Messaging) to email the underlying View as a CSV attachment on a schedule, for example every Monday morning, with a link to the published dashboard in the message.
Results to expect
Once the pipeline is running:
- Report prep: no manual export or cleanup, because every task runs in the pipeline
- Data freshness: as current as your last scheduled refresh
- Stakeholder access: anyone with the dashboard link (or an invite) can view it
Variations and next steps for the sales pipeline
Add multi-currency support
If your Salesforce instance uses multiple currencies, add a currency normalization task using Lookup to join against a currency conversion table.
Add historical trending
Set the refresh method on your Dataset Refresh automation to Combine to build a rolling history. Each run appends data rather than replacing the full dataset, so filter to recently modified records and remove duplicates to avoid double-counting.
Extend to forecast
Add a parallel pipeline for Forecast Category data and join it to your Opportunity dataset using the OpportunityId key.