Operational dashboards use case
Operations teams need to know what is happening now, not what happened last Monday when someone last exported from the ERP. This guide is for operations managers and analysts. It walks through building dashboards that pull from your operational databases and refresh on a schedule you set.
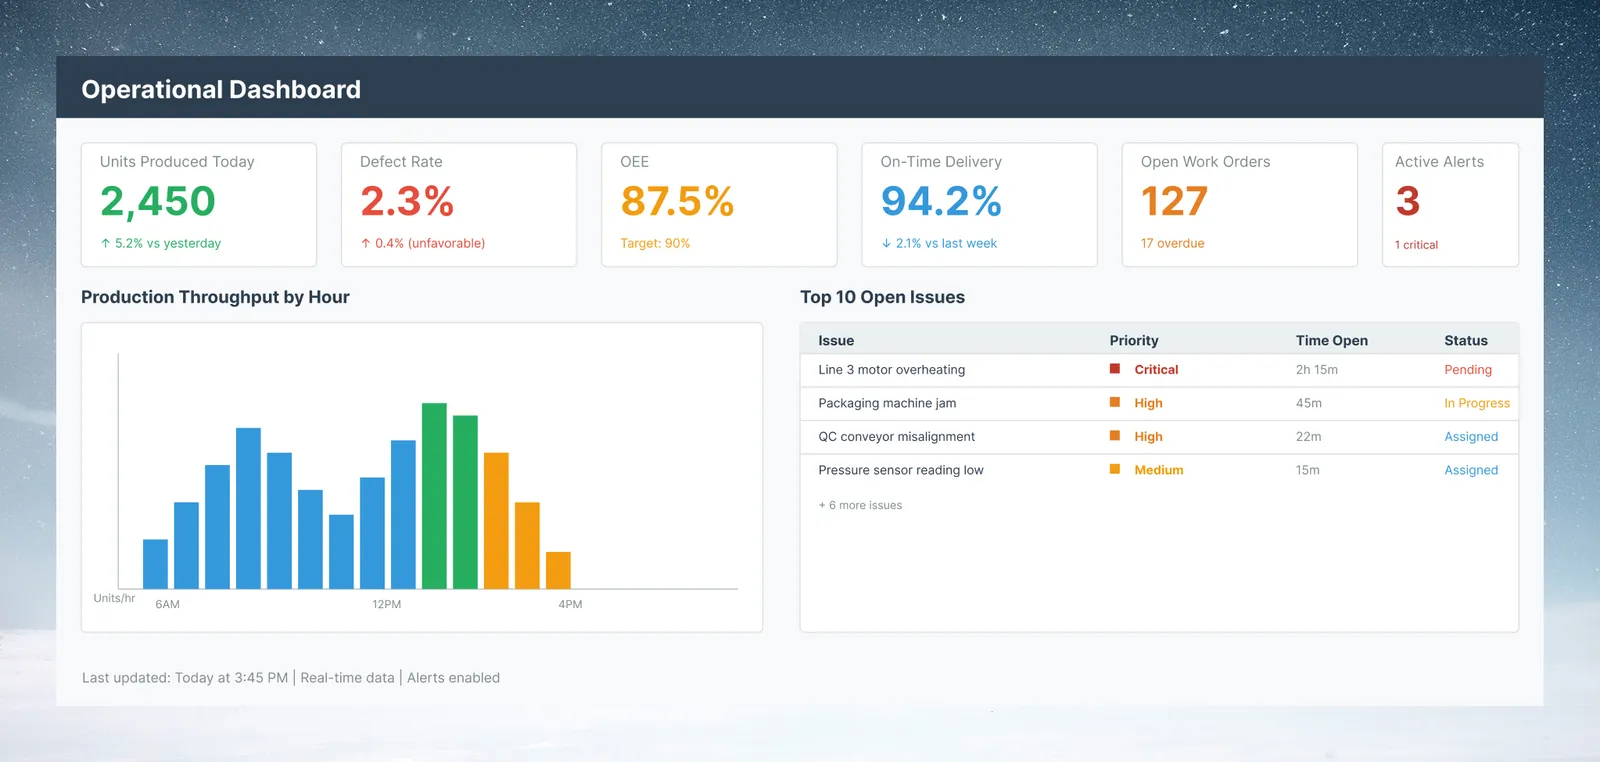
What you will build: An operations monitoring dashboard connected to your database, showing KPIs by shift, line, or region, refreshed on a schedule, with a shareable link that works on mobile.
Industries and KPIs this pattern covers
This pattern applies to:
- Manufacturing: production throughput, quality metrics, machine utilization (OEE)
- Retail: store-level sales versus plan, inventory levels, shrinkage
- Logistics: on-time delivery rate, open shipments, exceptions
- Field service: open tickets, SLA compliance, technician utilization
- Finance operations: transaction processing rate, exceptions, reconciliation status
The pattern is the same for each; only the KPIs and the database change.
Requirements
- A database that Mammoth can connect to (SQL Server, PostgreSQL, MySQL, Snowflake, and others—see Connectors)
- Read access to the relevant tables
- A Mammoth workspace and project
Step 1: Connect to your operational database
- In your Mammoth project's Data Library, click + New Dataset → Connectors
- Select your database type (SQL Server, PostgreSQL, Snowflake, etc.)
- Enter your connection credentials (Live Connections are stored per project)
- Select the tables or views you need
Tip: Use a database view
If your database does not allow direct connections from external IPs, use a database view that your DBA creates and grants read access to. This limits exposure to only the columns operations need.
Step 2: Build the transformation pipeline
Data from operational databases is rarely dashboard-ready. Common transformations include:
Filter to relevant time window
- Add a Conditional Filter:
ShiftDateis on or after a cutoff date (for example, 7 days back) - This keeps the dataset small and fast to query. The filter compares against a fixed value, so move the cutoff forward when needed, or filter in the source query instead
Standardize status codes
- Add Bulk Replace on status or code columns: "IN PROG" → "In Progress", "CMPLT" → "Complete"
- Use AI suggestion to catch all variants
Calculate KPIs
Use the Math function and Group & Pivot tasks:
| KPI | Formula | Implementation |
|---|---|---|
| OEE | (Availability × Performance × Quality) × 100 | Math function |
| Defect Rate | (DefectCount / TotalProduced) × 100 | Math function |
| On-Time Rate | Count of on-time rows / total rows × 100 | Group & Pivot (Count), then Math function |
| Throughput/Hour | Sum of Units grouped by HourOfDay | Group & Pivot |
Step 3: Create targeted Views
Create separate Views for different dashboard sections to keep each query fast:
- KPI Summary View: one row with today's summary metrics
- Hourly Throughput View: GROUP BY hour, last 24 hours
- Open Issues View: filtered to unresolved items, sorted by priority
- Line/Shift Comparison View: GROUP BY production line and shift
Each View updates whenever the underlying dataset refreshes (see Step 5).
Step 4: Build the dashboard with AI
- From any of your Views, click Create Dashboard
- Let AI generate the initial layout: "Build an operations dashboard with KPI summary cards at top, throughput trend by hour in the middle, and open issues table at the bottom"
- To use your other Views, ask the Dashboard Assistant to add or change the connected Views
Key design principles for ops dashboards:
- KPI cards first: managers need the headline numbers at a glance, no scrolling
- Color code for status: green, yellow, and red indicate whether each KPI is in target
- Trend, not just snapshot: a line chart of the last 24 hours is more useful than a single number
- Action items visible: the open issues table is the "what to do now" section
Step 5: Configure refresh
Operational dashboards need to stay current without manual intervention. A dashboard shows the data in its connected Views, so keep those datasets fresh with a Dataset Refresh automation:
- Open Automations in the project sidebar → New Automation → Dataset Refresh
- Select the dataset and set the schedule, for example every 3 hours (or daily for less time-sensitive operations). The shortest interval depends on your plan—see Scheduling
- In the dashboard's sync settings, turn on Sync automatically (new rows come into your draft when the pipeline runs) and Publish new data automatically (new rows go live as soon as they sync). Otherwise, new data reaches viewers only after you sync and publish
Step 6: Share with the operations team
Click Publish & Share on your dashboard, then set the Access Type:
For internal ops team (Mammoth users):
- Set Access Type → Authenticated
- Team members sign in to Mammoth and see the live dashboard
For floor managers and always-on displays (factory floor TVs, tablets):
- Set Access Type → Public: anyone with the link can view without signing in
- For floor displays: open the URL in a browser on the display; the data is as fresh as your last dataset refresh and dashboard sync
- For mobile access: managers open the URL on any phone or tablet—no app required
- Share the link via email, a posted QR code at the facility, or a pinned message in your ops Slack channel
Tip: Public links are not restricted
Public means anyone with the link can view. Share the link only through controlled channels (direct email, QR code in a secure facility) rather than posting it publicly. For highly sensitive operational data, use Authenticated and invite external users as workspace members.
Results to expect
- Managers read KPIs from a shared URL instead of emailing an analyst
- KPIs from several systems appear in one view
- The dashboard link opens on a phone or tablet, with no app required
Variations: multi-site, alerts and daily exports
Multi-site comparison
If you have multiple facilities, add a site filter dropdown to the dashboard. Managers can drill into their site or see the company-wide view.
Alert thresholds
Add a Data Check task with a Value range check on the KPI column (e.g., defect rate), set to Flag and continue or Pause the pipeline, and turn on Notify on failure to email the recipients you choose when the KPI goes out of range.
Export for daily standup
Schedule a daily 8 AM Messaging automation that emails the KPI summary View as a CSV attachment to the operations leadership group, so they have the numbers before the standup.