11 Best Client Dashboard Software Tools in 2026 (Tested & Ranked)
The best client dashboard software in 2026: Mammoth, AgencyAnalytics, DashThis, Whatagraph, Cyfe, Databox, Geckoboard, Klipfolio, Looker Studio, Zoho Analytics and Softr.
Client dashboard software gives each of your clients a live view of their own numbers: ad spend, leads, traffic, revenue, whatever you report on.
I tested eleven of the most popular tools and ranked them. This post covers what each one costs, who it suits, and where it falls down.
The short answer
Mammoth is the only reporting tool here where one dashboard serves every client, each seeing only their own rows. Pick it when the data needs cleaning first. AgencyAnalytics charges $20 per client, which suits agencies that think in clients. DashThis is the fastest preset report. Cyfe is the cheapest own-logo dashboard. Looker Studio is free. Softr builds a client portal, not a report.
“Client dashboard” means two different things
Search for client dashboard software and you get two different kinds of product mixed together in one list. Assembly, which ranks for this term, says so plainly in its own round-up: "Client dashboards vary a lot. Some just show data, while others are full portals where clients log in, see your branding, and collaborate with you."
Those are different purchases.
A client portal is where a client checks project status, downloads a contract or pays an invoice. Softr and Assembly build these, and what they show is your workflow.
A client reporting dashboard shows the numbers you produced for them instead: spend, return, pipeline, traffic. That is where AgencyAnalytics, DashThis, Whatagraph, Databox and Mammoth sit, and what they show is your data.
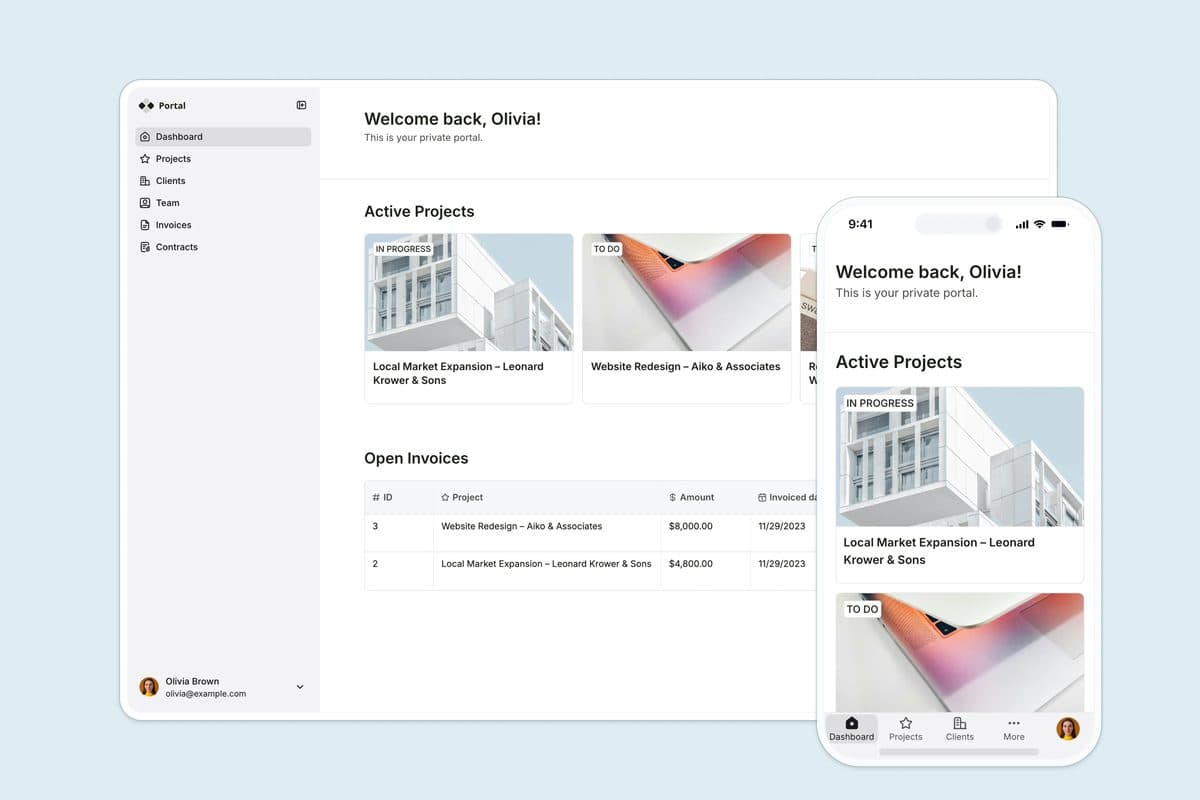
You can see the difference in that screenshot, where the navigation reads Projects, Clients, Team, Invoices, Contracts. There isn’t a metric anywhere on it, and that is exactly right, because it was never meant to be a reporting tool.
Most of this list covers the reporting half, since that’s where the "why are the numbers wrong" problem lives. I’ve included Softr so the portal option is on the table if that’s the job you were shopping for.
How the eleven compare
| Tool | Best for | Starts at |
|---|---|---|
| Mammoth | Data that needs cleaning first | Free, 3 dashboards |
| AgencyAnalytics | Per-client pricing | $20 per client |
| DashThis | Fast preset reports | $44 for 3 dashboards |
| Whatagraph | Large agencies | From €999 |
| Cyfe | Cheap white-label | $29 for 2 dashboards |
| Databox | Tracking metrics against goals | Free, 1 dashboard |
| Geckoboard | Numbers on a wall display | $79 for 2 dashboards |
| Klipfolio | Blended metrics | $120 a month |
| Looker Studio | Google data, no budget | Free |
| Zoho Analytics | Broad BI with a free tier | Free, 2 users |
| Softr | A client portal | Free plan |
Rates read off each vendor’s own pricing page on 24 September 2026, annual billing where offered. Monthly billing runs higher nearly everywhere.
The 11 best client dashboard software tools
1. Mammoth: best when the data needs cleaning first
Mammoth cleans and joins your data, then builds dashboards from it. The cleaning happens before the chart, which is the step most tools on this list skip.
That matters for client work more than internal work. Client data arrives in a different shape from every client. One sends a CSV export with merged header rows, another gives you API access, a third emails a spreadsheet where somebody typed "N/A" in a currency column. You reconcile all of it before anything can be reported, and that reconciliation is where the hours go.
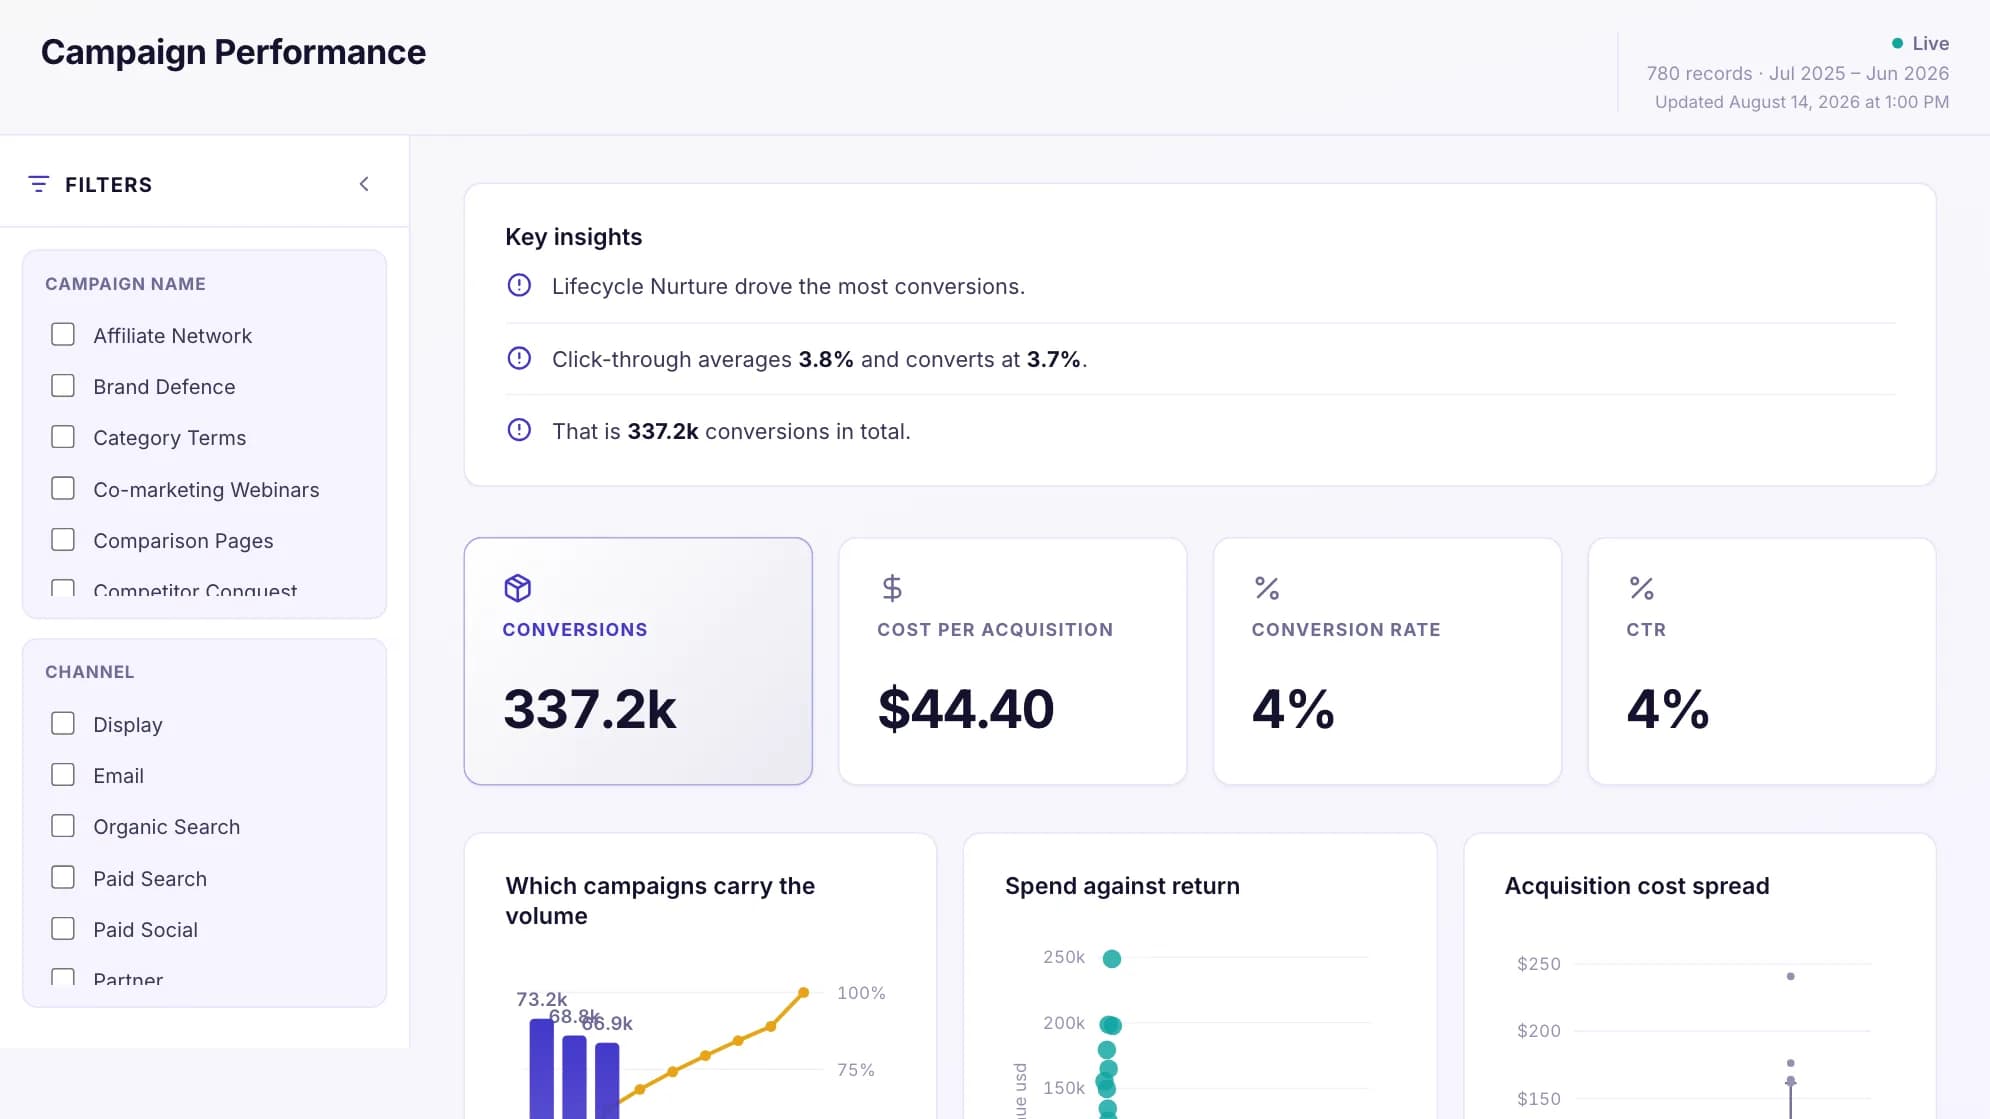
One dashboard for all your clients. Most tools here make you build a separate dashboard for every client. Mammoth doesn’t. You keep all your client data in one table, with a column saying which client each row belongs to. Then you build a single dashboard on top of it and tell Mammoth which client each person is allowed to see.
So when Acme logs in they get their own numbers, and when Globex logs in they get theirs. It’s the same dashboard underneath, but neither of them ever sees the other’s figures. Mammoth calls this Row-Level Security.
You can check it before you send anything, because a preview shows you what a given client will see. And if you forget to assign someone, they see nothing at all rather than everything, which is the safer way round. The filtering happens on Mammoth’s servers too, so there’s nothing in the page for a curious client to poke at.
The upshot is that signing your twentieth client doesn’t mean building a twentieth dashboard.
Your clients don’t cost you anything to add. You pay for the people who build dashboards. Anyone who only opens one is a viewer, and viewers are free and unlimited on every plan, including the free one. Share a report with a client, their finance team and their agency and it costs the same as sharing it with nobody.
The free plan is a working one. Three published dashboards, one person building them, and every way of sharing. That is one more published dashboard than Cyfe gives you at $29 and one more than Geckoboard gives you at $79, with no per-viewer licence on top. Refreshing is manual until you move to a paid plan, which is the real constraint rather than a feature lock.
Three limits worth knowing. The per-client filtering starts on the Pro plan, so it is not in the free tier. Each client has to log in with their own account, which is free but is still a step they have to take. And branding comes off in two stages. The Mammoth mark goes from the Team plan up. Your own logo on your own domain starts at Pro. If a logo on a dashboard is the entire requirement and nothing else here matters, Cyfe does that from $190.
Key features
- Clean and join messy data without writing code
- Describe the dashboard you want and it gets built for you
- Each client sees only their own data, and you can preview what they see
- Share by open link, by password, or by client login
- Reports refresh themselves on a schedule
- Unlimited free viewers on every plan
- A free plan with three dashboards and no card required
Pricing:
| Plan | Per month, billed annually | Billed monthly | Builders |
|---|---|---|---|
| Free | $0 | $0 | 1 builder |
| Starter | $39/month | $49/month | 2 builders |
| Team | $149/month | $189/month | 5 builders |
| Pro | $499/month | $629/month | 15 builders |
| Enterprise | From $5,000/month | Annual only | Unlimited |
Viewers are free and unlimited on every plan, because only builders count. Storage is a separate axis: every paid plan includes 10 GB, and more costs the same on any plan (+$100/month for 50 GB, +$300/month for 250 GB, +$800/month for 1 TB, billed annually). Free holds 1 GB. Every account starts with 14 days of Pro, no credit card.
2. AgencyAnalytics: best for per-client pricing
AgencyAnalytics is marketing reporting built for agencies. It costs $20 per client per month, billed annually, and that is the whole pricing model. Their page puts it plainly: you pay for the clients on your books and nothing else.
If you already think in clients, that removes a whole category of decision: win one and you add $20, lose one and you take it off again. Staff and client users are unlimited too, so nobody gets locked out of a report to save money.
The trade is that it’s built for marketing reporting and it’s very good inside that boundary and not useful outside it. More than 85 marketing integrations, white-label reports, client portals, automated sends. If your client work is SEO, paid media and social, this fits. If a client needs their warehouse data or their own product numbers in the report, you’ll be doing that somewhere else.
Watch the add-ons though, because they are priced separately: the AI Tracker runs $20.83 a month per 250 credits and the Rank Tracker $41.67 per 500 keywords, both on annual billing. Once you pass 25 clients you move onto custom pricing.
Pricing: $20 per client per month billed annually, with a 20% annual discount already applied.
3. DashThis: best for fast preset reports
DashThis builds marketing reports from presets. You connect a source, pick a template, and the report is there, with nothing else to set up. That narrowness is the whole appeal. If you report on your own marketing rather than clients', my guide to marketing dashboard software compares it with nine other tools.
Pricing is by dashboard, and their page says it plainly: you pay for the number of dashboards rather than for clients, sources or integrations. Individual gives you 3 for $44, Professional 10 for $139, Business 25 for $279, and Standard 50 or more for $429. Users are unlimited whichever you pick.
So the maths depends entirely on your habit. One dashboard per client, thirty clients, and you’re on the $429 plan. If you can make one dashboard serve several clients, you stay at $139.
Best for small agencies with a repeatable channel mix. Weakest where a client wants something bespoke, because bespoke is the thing presets don’t do.
Pricing: From $44 a month for 3 dashboards.
4. Whatagraph: best for large agencies
Whatagraph is marketing reporting for large agencies, and the price says so. The Max plan starts at €999 a month billed annually, which buys you 50 data source credits at one per connected source. Users and reports are both unlimited, though there is no free plan to try first.
That pricing tells you who it’s for. Past a certain scale the per-client models get expensive. If you run dozens of clients across the same few platforms, paying per source rather than per client works in your favour. Below that scale, this is a lot of money.
The product is strong on transferring data into a warehouse as well as reporting on it, which is why bigger agencies pick it over DashThis. If you connect the same five platforms across forty clients, the credit model works in your favour.
Pricing: From €999 a month, billed annually, from 50 source credits.
5. Cyfe: best for cheap white-label
Cyfe is a widget dashboard: lots of small tiles, each pulling one metric. It is the cheapest tool here that puts your own logo and domain on a client dashboard.
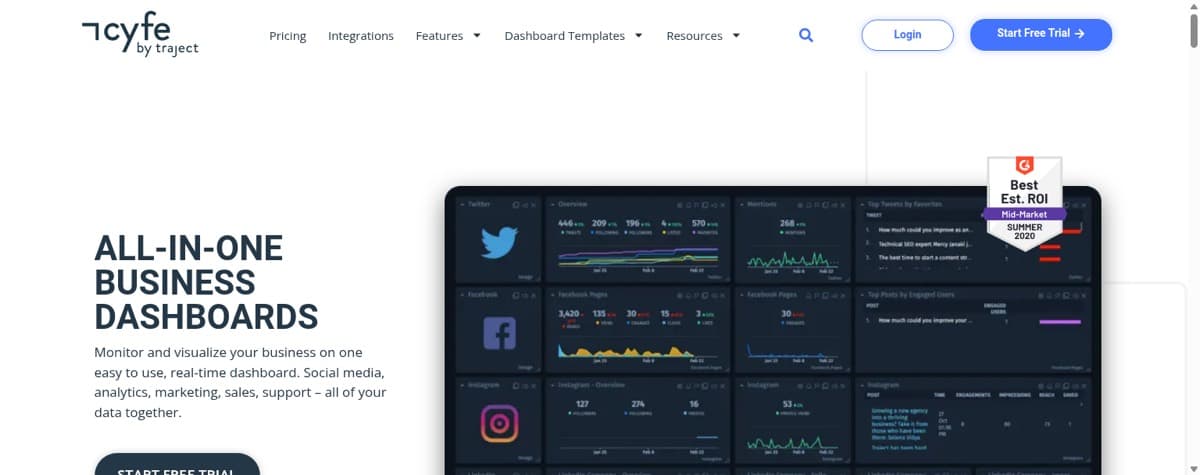
Every paid plan carries a custom logo and custom themes. The Agency plan, from $190 a month, adds full white-label, branded widgets, custom CSS and a custom SSL domain. You get 100 dashboards and 15 users, with each extra client at $19.
Nothing else on this list gives you your own domain and logo at that price. Whatagraph wants €999, and Mammoth carries the same capability on Pro for more than this. If white-label is a hard requirement and the budget is under $200, Cyfe is where that requirement gets met.
What you give up is depth, because Cyfe is shallow on purpose and doesn’t really do analysis. The lower plans are tight as well, with Starter giving you 2 dashboards and a single user for $29.
Pricing: From $29 a month, with the Agency plan from $190.
6. Databox: best for tracking metrics against goals
Databox tracks metrics against goals. It fits a client relationship that runs on a monthly scorecard rather than a designed report.
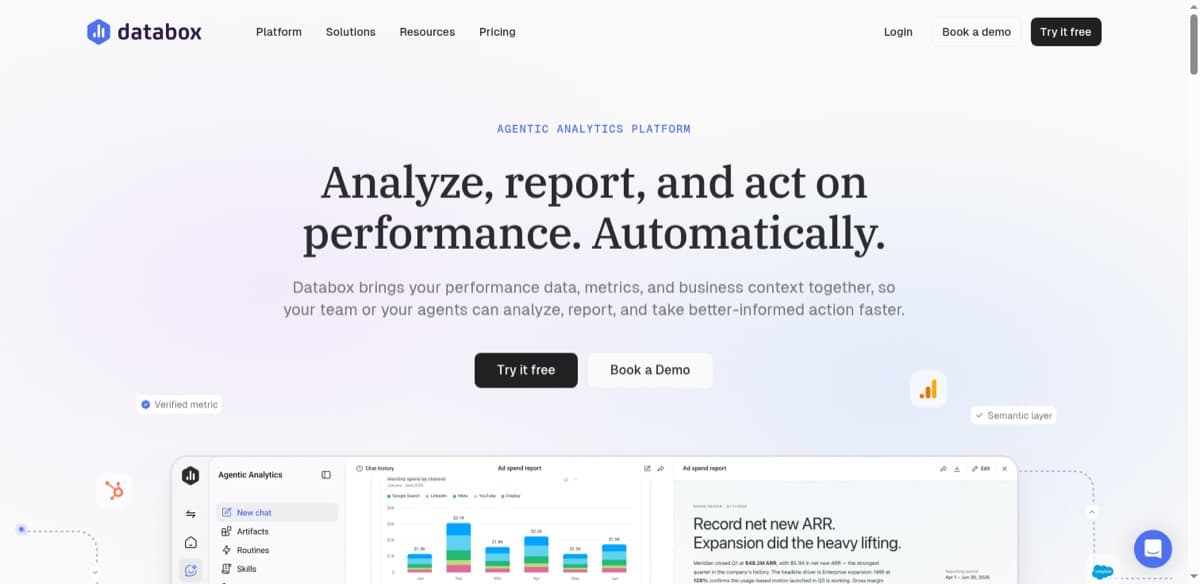
The free plan covers 1 user, 3 data sources and 1 dashboard, which is enough to decide whether you like it. Paid plans run from Analyst at $71 a month for a single user up to Team Scale at $319, with an Agency tier sold in client packs.
The catch is the one most tools here share: Databox charts what you hand it and does nothing to fix what you hand it. If your numbers are wrong because two systems disagree about what a conversion is, Databox will show you both wrong numbers on a tidy tile. We covered this at length in our Databox alternatives round-up.
Pricing: From $71 a month for the Analyst plan, annual billing.
7. Geckoboard: best for numbers on a wall display
Geckoboard puts live numbers on a screen. Big type, clear status, built to be read from across a room.
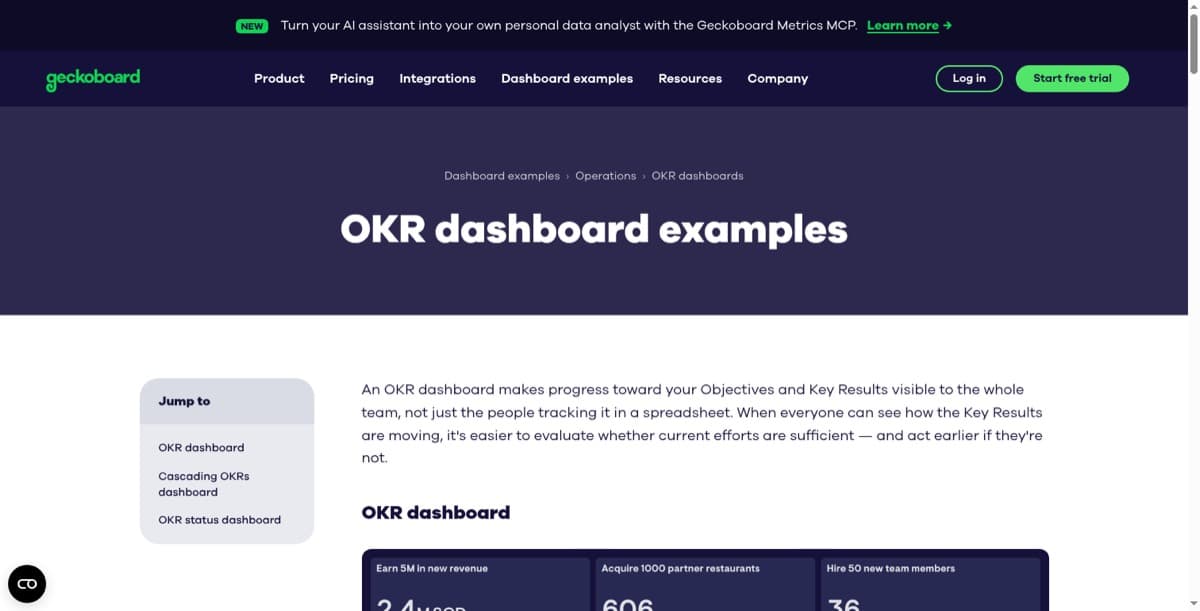
Viewers are unlimited and free on every plan, which is unusual and useful. What you pay for is editors and dashboards: Essentials starts at $79 a month with 2 dashboards and 1 editor, then charges $24 for each extra dashboard and $20 for each extra editor. Performance is $319 for 20 dashboards and 3 editors.
For client work it’s a partial fit. Fine for a shared live view of a campaign. Wrong for a monthly report with commentary, because it isn’t built to hold an argument, only a number.
Pricing: From $79 a month billed annually.
8. Klipfolio: best for blended metrics
Klipfolio blends metrics across sources and lets you write real formulas. It goes deeper than anything else at this price, so you can build the exact calculation a client keeps asking for.
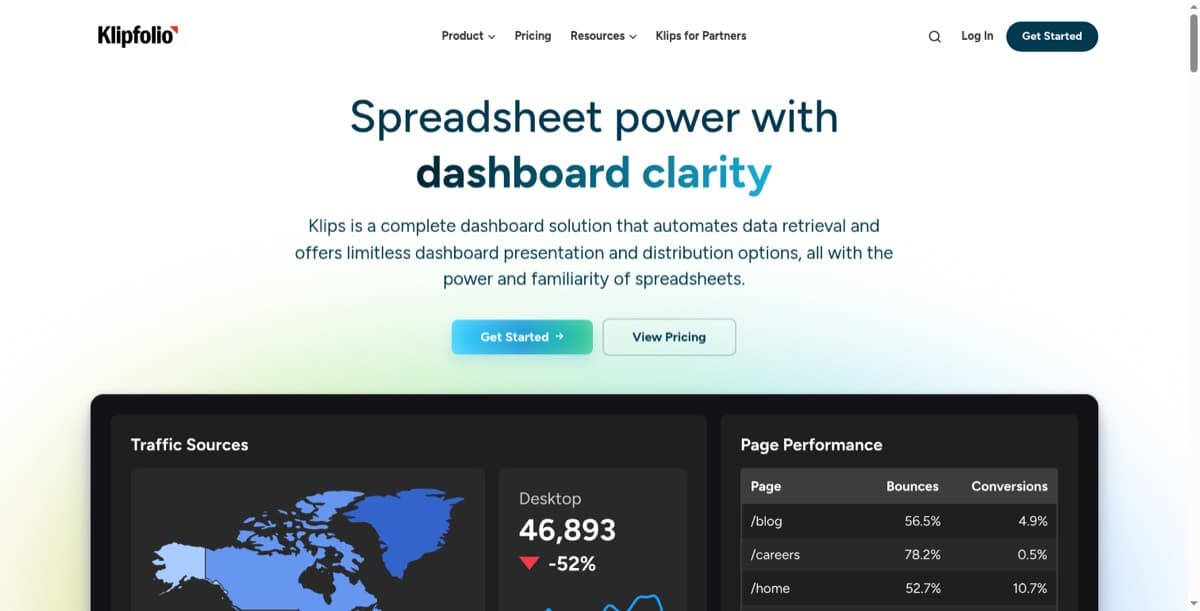
That power has a cost, and it’s the learning curve. Klipfolio rewards somebody who enjoys the tool and frustrates somebody who wants a report by Thursday. Users are unlimited, which suits agencies where a couple of technical people build for everyone.
Pricing: From $120 a month.
9. Looker Studio: best free option for Google data
Looker Studio is Google’s free reporting tool. It connects natively to Google Analytics, Google Ads and Search Console, and shares like a Google Doc. For a client whose world is Google, start here.
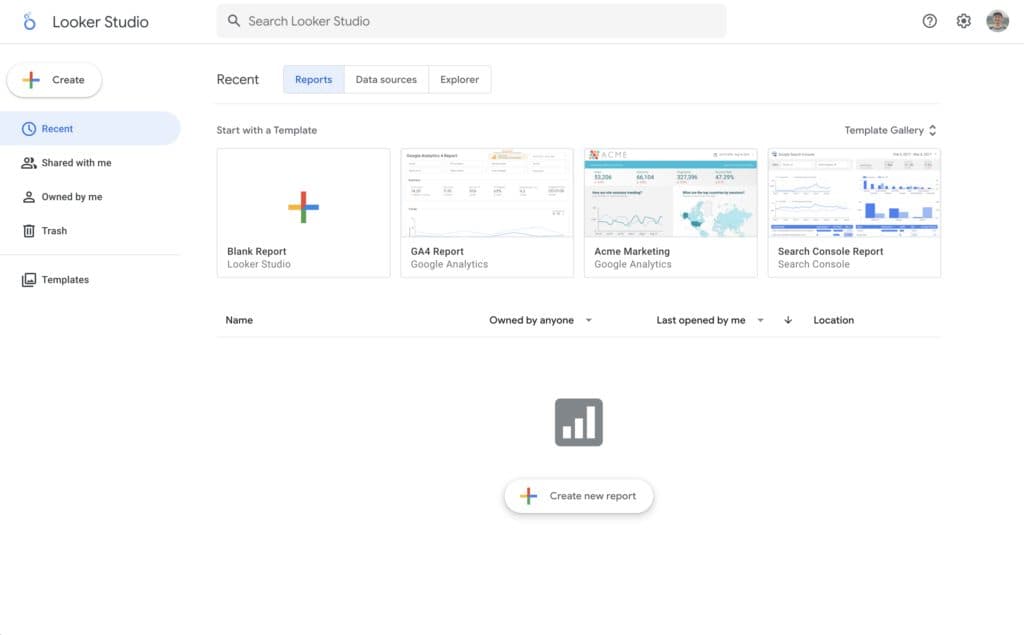
The limits show up as you scale, though. Non-Google sources need third-party connectors that cost money and break, and reports get slow against large or messy data. There is also no step for tidying data first, so anything needing a join happens in BigQuery or a spreadsheet before it reaches the report.
Free is the strongest feature here and it’s a real one. Plenty of agencies never outgrow it.
Pricing: Free, with Looker Studio Pro paid per user.
10. Zoho Analytics: best broad BI with a free tier
Zoho Analytics is a full BI tool with a wide connector list and AI-assisted analysis. Pricing scales on users and rows rather than dashboards, so reports and dashboards are unlimited on every plan.
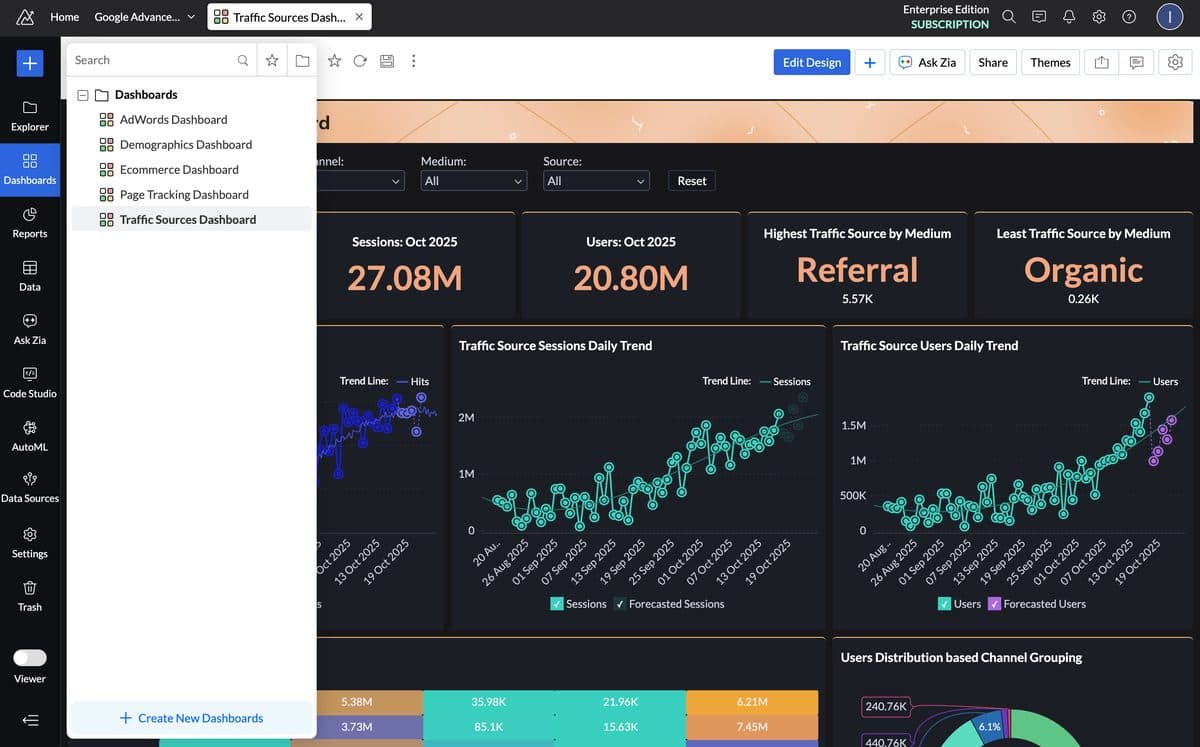
The panel on the left is the pattern this whole article is about: one saved dashboard per subject, and in agency use that usually means one per client.
The free plan covers 2 users, 10,000 rows and 5 workspaces with unlimited reports. Paid tiers start at 2 users and half a million rows and climb to 50 users and 50 million. Extra rows and users are add-ons. There’s a 15-day trial on paid plans with no card required.
The row ceiling is the thing to check before you commit. Client data adds up faster than people expect, and rows are the axis that moves you between plans.
Pricing: Free plan available, paid tiers priced per user with row-based limits.
11. Softr: best for a client portal
Softr builds client portals without code, on top of Airtable, Google Sheets or a database. A portal is where clients log in to check project status, approve work and pay invoices.
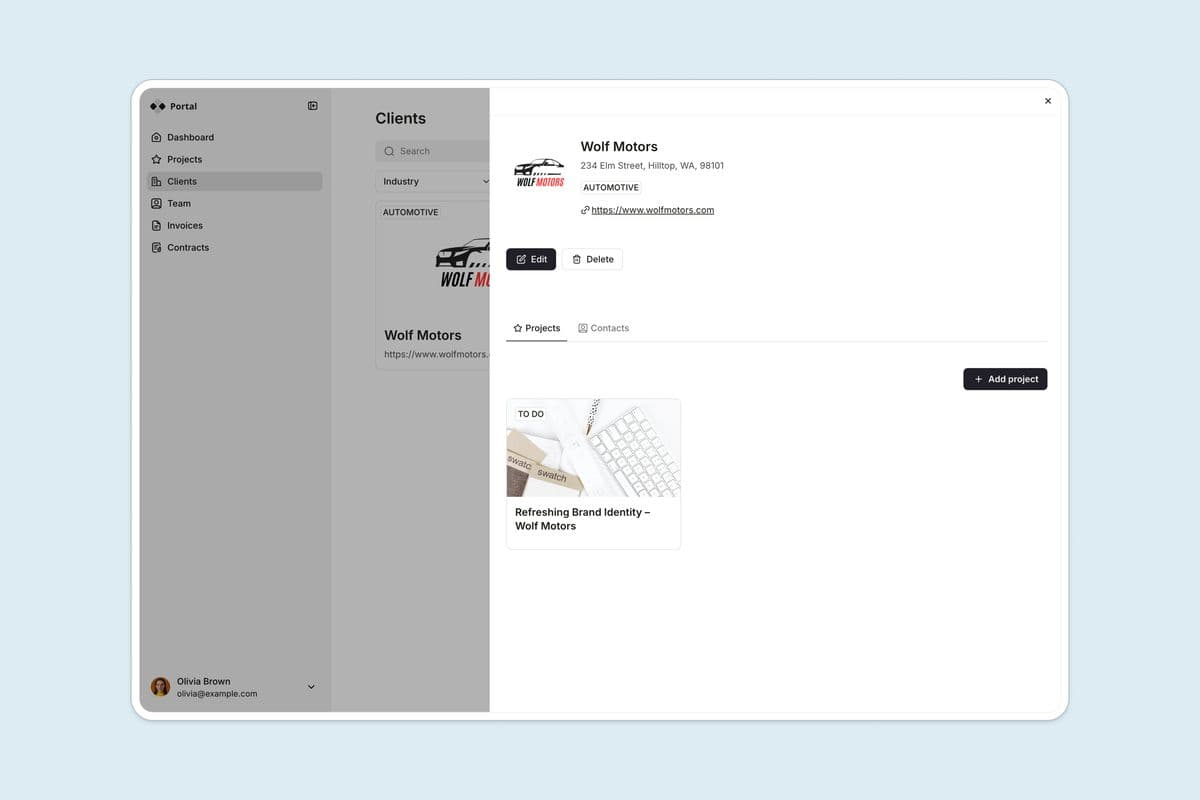
It handles the thing portals need and reporting tools handle awkwardly: per-client access control over records, with each client seeing only their own rows of a shared table.
It isn’t an analytics tool. Charts are basic and there’s no preparation layer. Plenty of agencies run Softr for the relationship and something else for the numbers, which is a sensible split rather than a compromise.
Pricing: Free plan available, with paid tiers priced by app users.
What puts the bill up as you grow
Check this once you have a shortlist, because these tools charge you for different things.
AgencyAnalytics charges per client, at $20 each. DashThis, Geckoboard and Cyfe charge per dashboard: DashThis gives you 3 for $44 and 25 for $279, Geckoboard 2 for $79 then $24 each after, Cyfe 2 for $29. Whatagraph charges per connected data source, from €999 for 50. Zoho Analytics charges per user and per row of data.
Four of the eleven charge per dashboard. Most agencies build one dashboard per client. Put those together and your client list quietly becomes a line item, which is the part worth knowing before you standardise on one of them.
Mammoth charges for builders rather than viewers or dashboards, so a client who only opens the report costs nothing on any plan. And because one dashboard can serve everyone, the twentieth client doesn’t need a twentieth dashboard.
How to choose
Start with portal or report. If clients need to see project status, files and invoices, that’s Softr or Assembly and most of this list is irrelevant. If they need to see numbers, carry on.
Then ask whether one dashboard can serve many clients. If it can, per-dashboard pricing stops mattering and your options widen considerably. Row-Level Security is what makes that possible in Mammoth, and it’s the difference between building thirty dashboards and building one.
Then check what puts the bill up. Growing your client list fast makes per-client pricing predictable but expensive. A stable client list with lots of reports per client makes per-dashboard pricing a trap. The same few sources across many clients makes Whatagraph’s credit model work in your favour.
Then check who needs to open it. Mammoth, Geckoboard and Looker Studio carry free unlimited viewers. Cyfe, Databox and Zoho count users. With external stakeholders this changes the total more than the headline price does.
Last, check the logo requirement. Cyfe Agency, from $190, is the cheapest real white-label here. AgencyAnalytics includes it. Mammoth puts your logo and your own domain on the Pro plan, with its own mark gone a tier earlier. Don’t discover this at the end.
Common questions about client dashboard software
What is client dashboard software? Two things, confusingly. Either a reporting tool that shows a client the metrics you produce for them, or a portal where a client logs in to see projects, files and invoices. Check which one a product means before comparing prices, because the categories barely overlap.
How do I stop clients seeing each other’s data? Three approaches. Build one dashboard per client and keep the links separate, which is what most tools assume. Use client portals or sub-accounts, as AgencyAnalytics and Whatagraph do. Or use row-level filtering, where one dashboard serves everyone and each viewer sees only their rows. Mammoth does the third on Pro and above, with unassigned viewers seeing nothing rather than everything.
What’s the cheapest client dashboard software? Looker Studio and Zoho Analytics both have real free tiers. Among paid tools, Cyfe starts at $29 a month and DashThis at $44. For white-label specifically, Cyfe’s Agency plan from $190 is the cheapest way to get your own logo and domain.
Can I white-label a client dashboard? Yes, though the price varies more than you’d expect. Cyfe includes full white-label on its Agency plan from $190 and a custom logo on every paid plan. AgencyAnalytics includes white-label reporting. Whatagraph starts at €999. Mammoth drops its own mark from the Team plan and adds your logo and your own domain on Pro.
Do clients need a login? It depends on the sharing model. Public links need nothing. Password-protected links need a shared password. Row-level filtering needs authenticated access, because the system has to know who’s looking in order to filter what they see. In Mammoth those viewer accounts are free and unlimited, so the requirement costs time rather than money.
How many dashboards do I need for 20 clients? Twenty, in most tools on this list, which is what makes per-dashboard pricing expensive at that point. One, if the tool filters rows by viewer. That single question changes the five-year cost more than any feature comparison will.
Is Looker Studio good enough for client reporting? For Google-centric clients with clean data, often yes, and free is a strong argument. It struggles with non-Google sources, large datasets and anything needing a join before it charts.
What about the data being wrong? No dashboard tool fixes that, with the exception of the ones that do preparation as well. If your numbers disagree because two systems define a conversion differently, a nicer chart shows you the disagreement in a better font. That problem gets solved upstream or not at all.
Can I use a BI tool instead? Yes, and Power BI, Tableau and Looker all do more analysis than anything here. They cost more per outside viewer, take longer to set up, and assume someone on staff maintains them. Our dashboard software comparison covers that trade in more detail.
What to settle before you pick
Most comparisons of these tools count connectors and chart types, which matter least of all, because every tool here draws a decent line chart.
What separates them is how much work they leave you. A tool that needs one dashboard per client hands you a maintenance job that grows every time you sign someone. A tool that charts whatever you give it leaves you cleaning the data by hand, exactly as before.
Decide those two first. The rest is preference.
Bring the messiest client export you have and see what comes back. No credit card needed.
Prefer a walkthrough first? Book a 20-minute demo.