Power BI Pricing: Complete Cost Breakdown for 2026
Power BI's pricing gets complicated fast when you factor in who needs licenses, data refresh requirements, and the hidden costs Microsoft doesn't advertise.
See what Mammoth would cost you, plan by plan.
Jump to a section
- Quick Answer: Power BI Costs
- The License Model Everyone Gets Wrong
- Power BI Pro: $14/User/Month
- Power BI Premium Per User: $24/User/Month
- Power BI Premium Capacity Is No Longer Sold
- Power BI Embedded
- What Power BI Doesn’t Include
- Power BI vs Competitors: Price Comparison
- Power BI Pro License: Cost, Features and What You Actually Get
- Power BI Premium vs Pro: The Honest Comparison
- Hidden Costs: What Teams Actually Spend
- When Power BI Makes Financial Sense
- When Power BI Gets Expensive
- If What You Need Is Dashboards, Not a Data Platform
- The Data Preparation Problem
- Alternative Approach: Automated Data Prep for Power BI
- Real-World Cost Examples
- Frequently Asked Questions
- Getting Accurate Pricing for Your Situation
- Is Power BI Pro worth it
- Fix your messy data without writing code
Looking for dashboards without Power BI’s complexity? Mammoth prepares your data and publishes dashboards from it, with no per-user fees and unlimited viewers on every tier. Free plan included; paid plans from $39/month. See the dashboard examples for what it publishes.
Power BI Pro costs $14 per user per month and Premium Per User costs $24, both paid yearly. Power BI Desktop and the free account cost nothing, but neither can share a report with anyone, so in practice everyone who opens a shared report needs a paid licence of their own.
That last rule is where most Power BI budgets go wrong. Below I go through every tier, what changed in 2025, and what a real team ends up paying.
Microsoft’s published prices on this page were verified against Microsoft’s Power BI pricing page on 2 October 2026. Fabric and Embedded capacity prices come from Azure’s pricing pages for the Central US region, read the same day.
The short answer
Power BI Pro is $14 per user per month and Premium Per User is $24, both paid yearly. Power BI Free exists but can't share reports with anyone, so every person who views a shared report needs a licence. Mammoth publishes dashboards with viewers free and unlimited on every plan; paid plans start at $39/month billed annually.
Quick Answer: Power BI Costs
Power BI Pro: $14/user/month, paid yearly
Power BI Premium Per User: $24/user/month, paid yearly
Power BI Premium Capacity (P-SKUs): no longer sold, replaced by Microsoft Fabric capacity (F64 from $5,002.67/month reserved)
Power BI Embedded: Azure capacity, billed hourly
Note: Power BI Free exists but can’t share reports with anyone.
⚠️ If you are working from a figure of $10 and $20, it is out of date. Microsoft raised Pro from $10 to $14 and Premium Per User from $20 to $24 on 1 April 2025: the first increase since Power BI launched.
The License Model Everyone Gets Wrong
The biggest Power BI pricing surprise: both creators and viewers need paid licenses (unless you buy Fabric capacity at F64 or above).
Common scenario:
- 3 analysts create reports
- 50 employees view dashboards
- Total licenses needed: 53 Pro licenses
- Monthly cost: $742/month ($8,904/year)
Many teams expect to pay for 3 creators, then discover they need 53 licenses when trying to share the first dashboard.
Power BI Pro: $14/User/Month
Best for: Teams where most people need to view AND occasionally edit reports.
What’s included:
- Full Power BI Desktop authoring tool
- Share content with other Pro users
- 10GB storage per user
- 8 dataset refreshes daily
- Collaborate on workspaces
- Content packs and API access
Real team costs:
| Team Size | Monthly Cost | Annual Cost |
|---|---|---|
| 5 users | $70 | $840 |
| 10 users | $140 | $1,680 |
| 25 users | $350 | $4,200 |
| 50 users | $700 | $8,400 |
| 100 users | $1,400 | $16,800 |
Key limitation: 1GB maximum dataset size. Reports with larger data require Premium.
Where per-user pricing stops being cheaper
Power BI Pro: $14/user/month, and everyone who views a report needs a license
Mammoth: flat monthly fee, unlimited dashboard viewers
Per-seat pricing is genuinely cheaper for small teams, and it is worth being precise about where that stops being true. At $14 per user per year-round seat, Power BI costs $168 per person per year. Mammoth Team is $1,788/year and Mammoth Pro is $5,988/year, both with unlimited viewers.
- Under ~11 people: Power BI Pro is cheaper.
- Around 36 people: Power BI Pro licenses pass Mammoth Pro’s flat annual fee.
- Above that: the gap widens with every person you add, because one side scales with headcount and the other does not.
That crossover is not unique to Power BI. I ran the same arithmetic across thirteen dashboard software tools, holding builders at three and moving only the readers, and the per-seat products separate from the flat-rate ones in the same place every time.
The reason to look past the licence line is usually not the licence line. It is the preparation work that happens before anything reaches a report.
What would Power BI cost your team?
Power BI Pro is $14 per user per month, and below F64 capacity everyone who opens a shared report needs one. Put in your own team to see where the crossover falls for you.
Your team
Connect sources, create pipelines, publish.
Read a dashboard, filter it, export from it.
Change it if you pay a different rate.
Power BI, 53 people
$742/mo
$8,904 a year
Mammoth Team · 50 viewers free
$149/mo
Covers 5 builders. Viewers never count.
You would pay $7,116 less a year.
Power BI prices from Power BI’s pricing page, checked 12 October 2026. Mammoth prices are the annual rates on our pricing page and include 10 GB of data. This compares licence cost only.
Power BI Premium Per User: $24/User/Month
Best for: Power users who need advanced features but don’t require enterprise capacity.
What Pro doesn’t have:
- Paginated reports (pixel-perfect formatting)
- Datasets over 1GB (up to 100GB)
- 48 refreshes daily (vs 8 with Pro)
- Dataflows for reusable ETL
- Deployment pipelines for dev/test/prod
- Advanced AI capabilities
Real costs:
| Users | Monthly | Annual | vs Pro Annual |
|---|---|---|---|
| 5 | $120 | $1,440 | +$600 |
| 10 | $240 | $2,880 | +$1,200 |
| 25 | $600 | $7,200 | +$3,000 |
When it’s worth it: Your datasets exceed 1GB or you need paginated reports. Otherwise, stick with Pro.
Power BI Premium Capacity Is No Longer Sold
This is the change most pricing guides have not caught up with. The P-SKU Premium capacity model, P1 through P5, the one every Power BI cost comparison used to be built on, is closed to new customers. Microsoft’s direction for capacity is now Microsoft Fabric, and existing Premium customers move to a Fabric SKU at the end of their agreement.
What replaced what:
| Retired P-SKU | Fabric equivalent |
|---|---|
| P1 | F64 |
| P2 | F128 |
| P3 | F256 |
Microsoft describes the capabilities as equivalent at each step, so an existing Power BI workload should behave the same after the move. F SKUs add OneLake, Dataflow Gen2 and Fabric Lakehouse/Warehouse access that P SKUs never had.
The migration is not automatic, and the timing has teeth. After a P SKU ends there is a 30-day grace period at no charge; from day 31 to day 90 operations are throttled; from day 91 they are rejected. You buy the F SKU in Azure and reassign each workspace by hand.
What capacity costs. Azure publishes Fabric capacity prices per SKU. In the Central US region, F64, the smallest size where viewers need no licence of their own, is $8,409.60 a month pay-as-you-go, or $5,002.67 a month on a one- or three-year reservation, which Microsoft says saves about 41%. Prices vary by region, so check Azure’s Fabric pricing page for yours. Smaller SKUs start at $262.80 a month for F2, but below F64 every viewer still needs Pro, so they don’t help with reach.
Where capacity beats Pro. Whoever publishes reports needs Pro either way, so the real comparison is F64 against Pro for your viewers. A reserved F64 costs $60,032 a year, the price of 357 Pro licences at $168 each, so it’s cheaper from about 358 viewers. Pay-as-you-go F64 costs $100,915 a year, about the same as 600 Pro licences. Below a few hundred viewers, Pro wins on licences alone.
For the official detail, see Microsoft’s Premium to Fabric migration FAQ.
The alternative to buying capacity for reach
Capacity existed largely to solve one problem: letting a lot of people look at a dashboard without buying a lot of licenses.
Mammoth: $5,988/year for Pro, with unlimited dashboard viewers on every tier, including Free.
If what you need is dashboards that a wide audience can see, rather than an analytics workspace, the viewer economics are the whole comparison:
- Viewers are unlimited and free, on every tier
- Data preparation is recorded and re-runnable, so the refresh is not a manual job
- No gateway infrastructure to host or maintain
More on how that works in the data engine.
Power BI Embedded
Best for: Software vendors embedding reports in applications.
How it works:
- Azure capacity billed by the hour, not by user
- Pay only when capacity is running
- Scale up or down based on demand
- No user licenses required for app users
Cost optimization: Pause capacity outside business hours. An embedded workload running 12 hours a day rather than continuously costs roughly half as much, and this is the single largest lever on the bill.
What Embedded costs. Azure’s Power BI Embedded pricing page lists each node size by the month, running continuously. In Central US an A1 node (1 virtual core, 3 GB of memory) is $735.91 a month and an A4 (8 cores, 25 GB) is $5,881.25. Pausing outside working hours cuts that in proportion.
Every node size, the licences Embedded still needs and two worked monthly bills are in Power BI Embedded pricing.
What Power BI Doesn’t Include
Data Gateway Requirements
Connecting to on-premise data requires:
- Windows Server for gateway hosting
- Always-on infrastructure
- IT maintenance overhead
Gateway hosting and maintenance is a real line item that rarely appears in a licence comparison, because it lands on the IT budget rather than the analytics one.
Power Query Limitations
Power Query is included but has significant limitations:
- Manual refresh requirements
- No scheduling in Free tier
- Limited transformation capabilities
- Performance issues with large datasets
Microsoft 365 Integration Requirements
Teams integration and certain sharing features assume Microsoft 365 licensing, which many organisations already hold. If you don’t, check Microsoft’s 365 pricing: the enterprise plans are priced per user per month and are a separate line from Power BI.
Note that Power BI Pro is included in some Microsoft 365 enterprise bundles, which is worth verifying before you buy it standalone.
Training Costs
Power BI’s learning curve requires investment:
- Official Microsoft training courses, priced per course
- PL-300 certification exam
- Learning DAX formulas, data modeling, Power Query
User reviews on G2 and TrustRadius consistently mention the steep learning curve for DAX calculations and complex data modeling. This is the cost that varies most between organisations, and the one worth estimating from your own team rather than from anyone’s table.
Power BI vs Competitors: Price Comparison
Understanding Power BI’s position in the business intelligence market helps assess value. All figures below are the vendors’ own published prices, re-read on 2 October 2026.
| Tool | Published entry price | 10 users | 100 users |
|---|---|---|---|
| Power BI Pro | $14/user/mo | $1,680/yr | $16,800/yr |
| Tableau | $75/user/mo (Creator, Standard edition) | $9,000/yr | $90,000/yr |
| Qlik Cloud | $300/mo (Starter, 10 users included) | $3,600/yr | quote |
| Looker | not published: quote only | quote | quote |
Two caveats worth carrying. Tableau now sells in editions, and Creator is $115/user/month on Tableau Enterprise rather than $75. So a like-for-like comparison depends which edition you are quoted. Qlik’s Starter tier includes 10 users and 10GB in the $300, so it is not a per-seat figure and does not scale the way the others do.
Power BI’s pricing advantage is real for small teams. For the full Tableau breakdown, see Tableau pricing.
The two side by side, Microsoft-estate economics against free viewers with prep included: Mammoth vs Power BI.
The two side by side, Microsoft-estate economics against free viewers with prep included: Mammoth vs Power BI.
Power BI Pro License: Cost, Features and What You Actually Get
A Power BI Pro license is Microsoft’s paid individual tier that unlocks collaboration, sharing, and scheduled data refresh. Without it, Power BI is largely a personal desktop tool.
What does a Power BI Pro license do?
Power BI Pro enables everything the free version withholds: publishing reports to shared workspaces, collaborating with colleagues, scheduling automatic data refreshes, and consuming reports shared by others.
In practice, every person who needs to view a shared Power BI report requires a Pro license, not just the people building them. That single fact is responsible for a significant portion of organisations’ unexpected Power BI spend.
Pro also enables access to the Power BI service (the cloud-hosted platform), app workspaces for team collaboration, and integration with Microsoft 365 tools including Teams and SharePoint.
How much does a Power BI Pro license cost?
Power BI Pro costs $14.00 per user per month, paid yearly [Microsoft, 2 October 2026]. The real cost consideration is headcount.
A team of 20 users building and viewing reports pays $3,360 per year. But if your finance team, regional managers, or external stakeholders also need to view those reports, every one of them requires their own Pro license.
A 50-person organisation where 30 people need view access reaches $5,040 per year before accounting for premium features, additional storage, or refresh requirements.
How to get a Power BI Pro license?
Pro licenses are managed through the Microsoft 365 admin centre. Administrators can assign licenses individually or in bulk, and Microsoft offers a free trial for organizations evaluating the tier.
Power BI Pro is also included in Microsoft 365 E5 and certain other enterprise Microsoft bundles (worth verifying before purchasing standalone).
Where Power BI Pro breaks down
The license cost is only part of the real investment. Pro enforces a 1 GB dataset size limit per workspace and a maximum of eight scheduled refreshes per day. For teams working with larger datasets or requiring near-real-time reporting, these limits force a jump to Premium, a substantially higher cost tier.
More significantly: a large share of analyst time goes on preparing and cleaning data before it ever reaches Power BI. The Pro license fee is the visible cost. The invisible cost is analyst time spent on manual preparation, reconciliation, and formatting: work that happens before a single report is built.
Mammoth Analytics is built for that stage of the work, and some of its customers use it to feed Power BI rather than replace it.
Power BI Premium vs Pro: The Honest Comparison
Power BI Premium is Microsoft’s capacity-based tier, designed for organisations that need larger datasets, higher refresh frequency, or the ability to share reports with viewers who don’t hold individual Pro licenses. In 2026 it is a tier in active transition, which matters for anyone evaluating it as a long-term investment.
What does Power BI Premium include?
Power BI Premium Per User costs $24 per user per month, paid yearly, and raises the dataset limit from 1 GB to 100 GB and daily refreshes from 8 to 48. Every viewer of a PPU report still needs a PPU licence of their own.
Premium Capacity (the P-SKU model) worked differently: you purchased a dedicated capacity block rather than per-user licenses, so viewers could access reports without holding individual licenses. That model is closed to new customers: see the section above.
Power BI Premium vs Pro: Feature Comparison
| Feature | Power BI Pro | Premium Per User | Fabric capacity |
|---|---|---|---|
| Price | $14/user/month | $24/user/month | F64: $5,003–$8,410/mo |
| Dataset size | 1 GB | 100 GB | By capacity SKU |
| Daily refreshes | 8x | 48x | 48x |
| Viewers need licenses | Yes | Yes | No, from F64 up |
| Advanced AI features | No | Yes | Yes |
| Best for | Small teams | Power users | Large enterprise |
Is Power BI Premium being discontinued?
Yes, in its P-SKU form. Microsoft closed P-SKU Premium capacity to new purchases and is moving existing customers onto Microsoft Fabric SKUs at renewal. Premium Per User is unaffected and is still sold at $24 per user per month. If you are evaluating capacity licensing today, Fabric F-SKUs are the correct starting point.
What is Microsoft Fabric and how does it replace Premium?
Microsoft Fabric is Microsoft’s unified analytics platform, consolidating Power BI, Azure Synapse, Data Factory, and other services under a single licensing model.
F-SKUs replace P-SKUs for new buyers at equivalent capacity levels, and include access to the broader Fabric platform rather than Power BI capacity alone.
Which tier do you actually need?
For teams under 25 users with datasets under 1 GB: Pro is sufficient. For power users needing larger datasets, higher refresh rates, or advanced AI features: Premium Per User is the logical step. For large organizations distributing reports broadly to viewers who should not each hold a license: Fabric capacity is the appropriate model.
Whether you choose Pro, Premium, or Fabric, the return on it depends on the quality of data feeding into your dashboards.
Hidden Costs: What Teams Actually Spend
Data Preparation Time
The largest hidden cost isn’t licenses, it’s data preparation.
Refresh and Performance Issues
Common pain points:
- Pro tier: Only 8 refreshes daily
- Dataset size limits force data reduction
- Complex DAX calculations slow reports
- Gateway failures disrupt scheduled refreshes
Teams often need capacity to solve performance issues, even with small user counts, and the capacity size that frees viewers from licences, F64, starts at $5,002.67 a month reserved.
License Sprawl
Year 1: 5 Pro licenses = $840/year
Year 2: Marketing wants access (10 more licenses) = $2,520/year
Year 3: Sales needs dashboards (20 more licenses) = $5,880/year
Year 4: Company-wide rollout to 400 people = $67,200/year
Year 4 is where the comparison flips. A reserved F64 at $60,032 a year, plus Pro for the people who publish, now costs less than licensing everyone, so run that sum before the renewal rather than at it.
When Power BI Makes Financial Sense
Power BI delivers value when:
- You’re in the Microsoft ecosystem – Already using Azure, 365, Teams
- Small creator teams – 5-10 people build reports for themselves
- Budget-conscious starts – $14/user still undercuts most of the category
- Enterprise with large viewer populations – capacity economics can work
When Power BI Gets Expensive
Teams struggle with return on it when:
- Large viewer populations – every viewer is another $14/user/month
- Data preparation dominates – most of the effort lands before visualization
- Performance requirements – forced into capacity licensing early
- Complex data landscapes – Multiple sources requiring constant cleaning
- Training overhead – DAX and data modeling are not a weekend
If you’re experiencing 3+ of these issues, consider Mammoth:
| Challenge | Power BI Reality | Mammoth |
|---|---|---|
| Large viewer groups | $14/user/month | Flat plan fee, $39/month to $499/month (unlimited viewers) |
| Data preparation | Where most of the time goes | Recorded, re-runnable preparation |
| Dashboard creation | DAX, modeling, Power Query | Built from prepared data, no code |
| Gateway management | Infrastructure to host | Cloud-native, no gateways |
If What You Need Is Dashboards, Not a Data Platform
If you’re evaluating Power BI primarily for dashboards rather than advanced analytics workspaces, the comparison is narrower than the feature lists suggest.
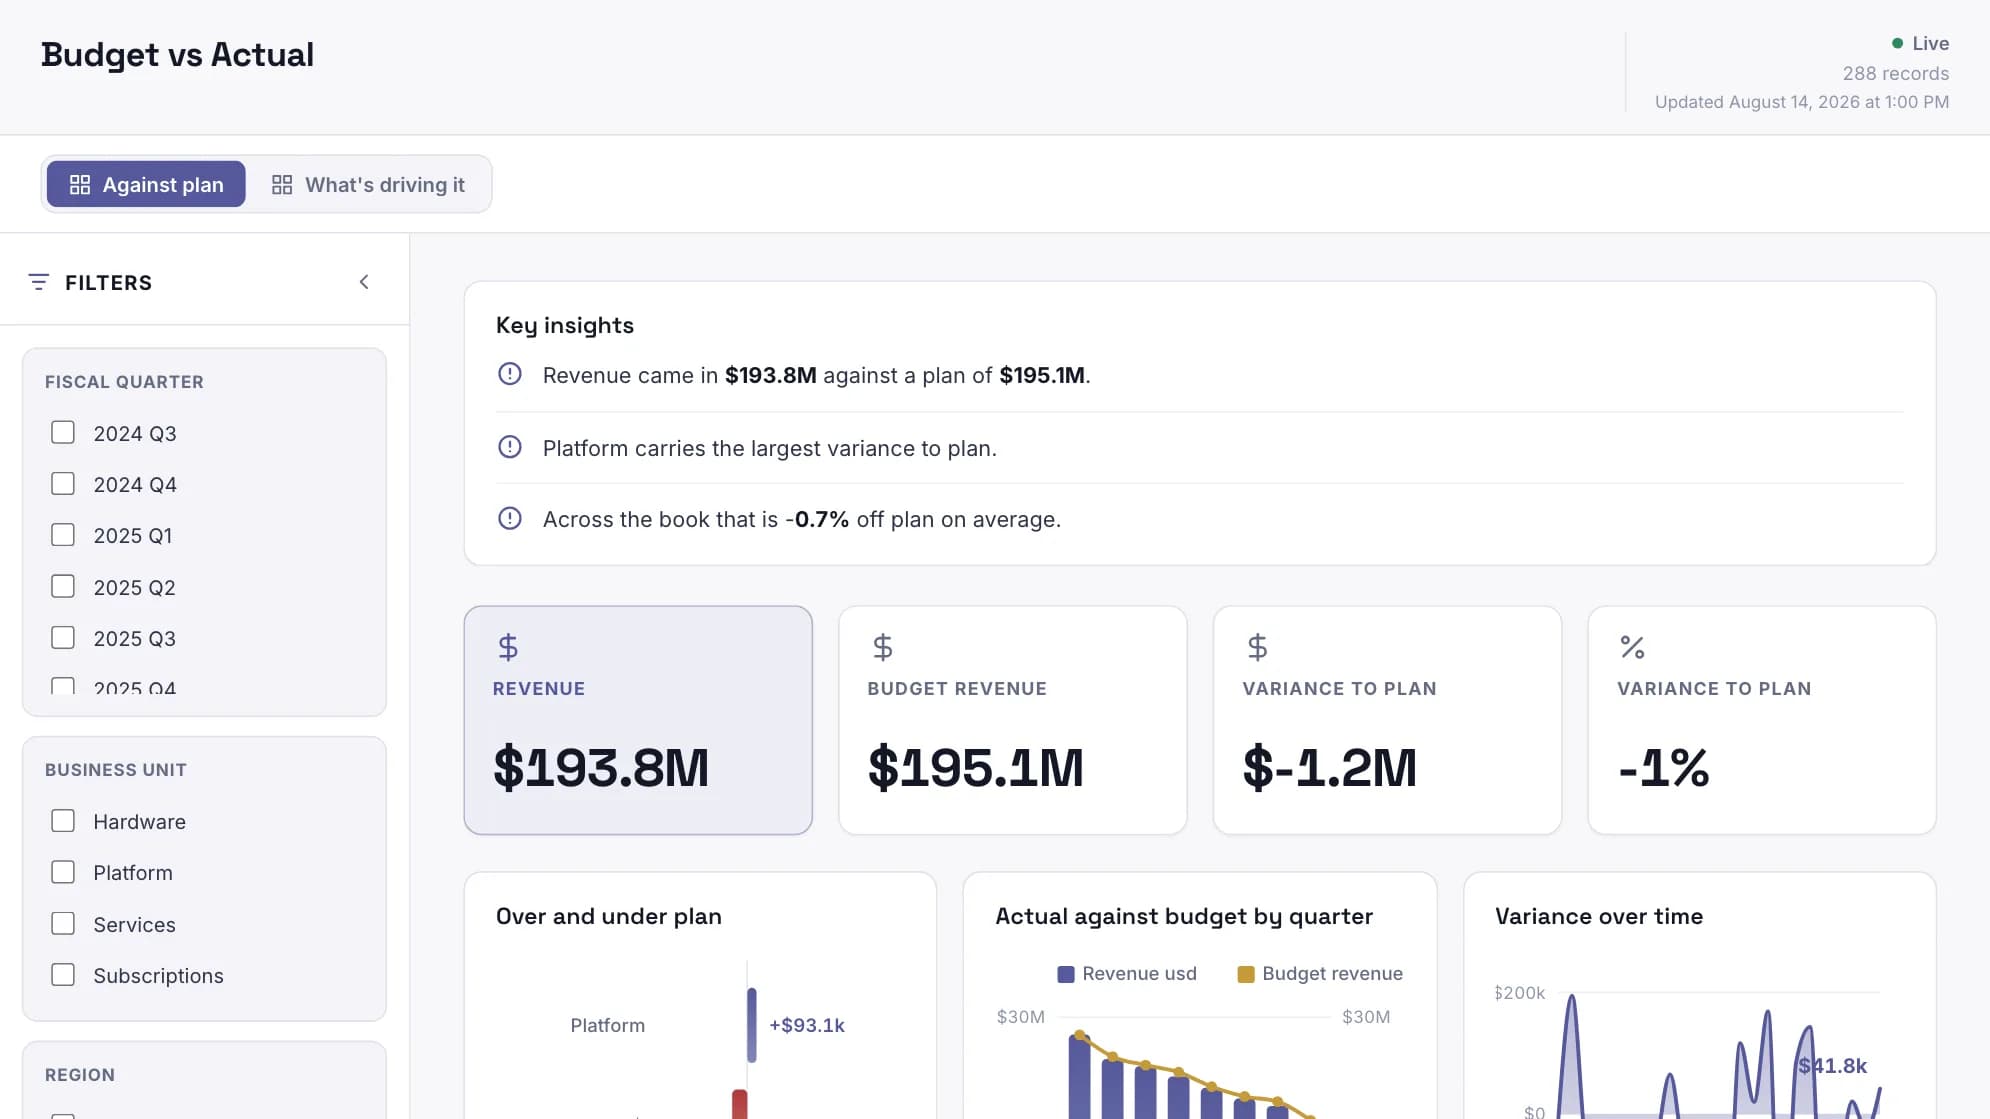
Power BI dashboard creation
- License model: $14/user/month for creators and viewers alike
- Tools to learn: DAX formulas, Power Query, data modeling
- First-year licence cost (10 people): $1,680, plus training
Mammoth
- License model: flat plan fee from $39/month to $499/month, billed annually, unlimited viewers
- Tools to learn: none. The preparation is recorded as you do it
- First-year cost (10 people): $5,988/year (Pro, up to 15 builders, billed annually)
Cost comparison by team size:
| Team Size | Power BI Annual | Mammoth Annual |
|---|---|---|
| 3 people | $504 | $1,788/year (Team) |
| 10 people | $1,680 | $5,988/year (Pro) |
| 50 people | $8,400 | $5,988/year (Pro) |
| 100 people | $16,800 | Enterprise |
Licence cost only. Neither column includes training, gateway hosting or preparation time. Mammoth’s column takes everyone as a builder up to Pro’s 15; past that, viewers are free and unlimited, so 50 people with up to 15 builders still fits Pro.
The table is the honest version of this argument: Power BI is cheaper on licences until roughly 36 people, and more expensive after. If your audience is small and technical, that favours Power BI. If it is large and non-technical, it does not.
When Mammoth makes sense
- A wide viewer audience you don’t want to license per head
- Standard reporting needs (KPIs, trends, performance metrics)
- Growing team, where per-user cost scaling is the problem
- The work before the dashboard is the bottleneck
When Power BI still makes sense
- Advanced analytics workspaces required
- Deep Microsoft ecosystem dependency
- Complex data modeling with custom DAX
- Already have a trained Power BI team
If that is you, Power BI is the right call. If it is not, see how the data engine handles the prep.
The Data Preparation Problem
Power BI assumes you have clean, analysis-ready data. Most organizations don’t.
Before Power BI can visualize anything:
- Extract data from multiple sources
- Consolidate disparate formats
- Standardize naming and structure
- Handle missing values and duplicates
- Clean data quality issues
- Schedule automated refreshes
This data workflow typically requires:
- Power Query knowledge (limited capabilities)
- SQL for complex transformations
- Python/R for advanced logic
- Gateway infrastructure for on-premise data
Alternative Approach: Automated Data Prep for Power BI
If you’re committed to Power BI but struggling with data preparation, smart teams separate data preparation from visualization:
Data Preparation Layer:
- Mammoth Analytics: from $39/month (Starter, 2 builders) to $499/month (Pro, 15 builders), billed annually
- Handles data consolidation, cleaning, transformation
- No-code interface for business users
- Scheduled refreshes feeding Power BI
- Eliminates gateway complexity
Visualization Layer:
- Power BI Pro: Focus on analysis and dashboards
- Analysts spend more time finding insights
Example cost for 5-person team:
- Mammoth Team: $149/month (5 builders, billed annually)
- Power BI Pro (5 users): $70/month
- Combined: $149/month plus $70/month
Example cost for 2-person team:
- Mammoth Starter: $39/month (2 builders, billed annually)
- Power BI Pro (2 users): $28/month
- Combined: $39/month plus $28/month
Real-World Cost Examples
Small Business (10 employees)
- 2 analysts create reports
- 8 managers view dashboards
- Cost: 10 Pro licenses = $140/month ($1,680/year)
- Capacity licensing is not worth evaluating at this size
Mid-Market (100 employees)
- 5 analysts create reports
- 45 managers view regularly
- 50 executives view occasionally
- Cost: 100 Pro licenses = $1,400/month ($16,800/year)
- Alternative: a reserved F64 ($60,032/year) plus 5 Pro licences for the analysts ($840) = $60,872/year
- Pro is cheaper by about $44,000 a year at this size
Enterprise (500+ employees)
- 10 analysts create reports
- 490+ employees view dashboards
- Cost with Pro: 500 licenses = $7,000/month ($84,000/year)
- Cost with capacity: a reserved F64 ($60,032/year) plus 10 Pro licences for the analysts ($1,680) = $61,712/year
- Better choice on licences: capacity, by about $22,000 a year
Key insight: on licences alone, a reserved F64 overtakes Pro at about 358 viewers, and pay-as-you-go F64 at about 600. Performance can push you to capacity sooner, because Pro caps a dataset at 1 GB and eight refreshes a day.
Frequently Asked Questions
How much does Power BI Pro cost?
Power BI Pro costs $14 per user per month, paid yearly, which is $168 per user per year. Everyone who publishes or views a shared report needs one, so a team of 3 report builders and 20 readers pays for 23 licences: $3,864 a year.
Is Power BI completely free?
No. Power BI Desktop is a free download and the free account lets one person build reports, but sharing a report needs a paid licence for the person sharing and for everyone viewing: Pro at $14 or Premium Per User at $24 per user per month. The exception is Fabric capacity at F64 or above, where viewers don’t need a licence of their own.
Is Power BI free with Office 365?
Only on the E5 plans. Microsoft includes Power BI Pro in Microsoft 365 E5 and Office 365 E5, and lists no other Microsoft 365 or Office 365 plan as including it. On any other plan you get the free account, and sharing reports means buying Pro separately.
Can I share reports from Free tier?
No. Free tier users can build reports but cannot share them. Both creator and viewer need paid licenses.
Did Power BI prices go up?
Yes. Microsoft raised Power BI Pro from $10 to $14 per user per month and Premium Per User from $20 to $24, effective 1 April 2025. Guides still quoting $10 and $20 predate that change.
What’s the difference between Premium Per User and capacity licensing?
PPU ($24/user) gives one person Premium features. Capacity is bought once for the organisation, now as a Microsoft Fabric SKU through Azure rather than a Power BI P-SKU, and from F64 up it lets people view reports without a licence of their own.
How much does Power BI Premium capacity cost?
Microsoft no longer sells Power BI Premium capacity (the P SKUs). Its replacement is Microsoft Fabric capacity, and the size that matches P1 is F64: $8,409.60 a month pay-as-you-go or $5,002.67 a month on a reservation, in Azure’s Central US region. That’s $60,032 a year reserved, which costs less than Pro licences from about 358 viewers.
Do viewers need licenses if I have capacity?
Only from F64 (or the retired P1) up. Microsoft lifts the per-viewer licence at those sizes and no smaller, so on F2 to F32 viewers still need Pro. Whoever publishes the reports needs Pro at every capacity size.
Can I mix Pro and Premium Per User licenses?
Yes, within the same organization. Useful for giving advanced features to power users while keeping others on Pro. Anyone who already holds Pro, Microsoft 365 E5 or Office 365 E5 can step up to Premium Per User with a $14 per user per month add-on, paid yearly.
How do dataset size limits work?
Pro: 1GB per dataset. Premium Per User: 100GB. Capacity: based on the SKU you buy.
Is there a free trial?
Yes. Starting a Microsoft Fabric trial from your Power BI account gives you 60 days free, with a trial capacity and an individual trial that includes the features of Premium Per User. You need a work or school email to sign up, and your admin can switch trials off.
Getting Accurate Pricing for Your Situation
Your actual Power BI costs depend on:
- Creator vs viewer ratio – Determines Pro vs capacity decision
- Dataset sizes – May force Premium Per User or capacity
- Refresh requirements – More than 8/day needs Premium
- Microsoft 365 licensing – May already be covered
For teams under 50 users, self-service signup works well. For enterprise deployments, price a reserved F64 against your viewer count first, then take that number to your Microsoft account team.
Is Power BI Pro worth it
Power BI Pro at $14/user/month remains one of the most affordable business intelligence platforms available. Microsoft can price it that way because it profits from Azure, 365, and the broader ecosystem.
But the real question isn’t “What does Power BI cost?” but rather “What does our complete analytics process cost?”
For most teams the licence line ($1,680-$16,800/year at typical sizes) is not the largest number. The largest number is the time spent preparing data before any visualization happens.
Understanding the true cost of manual data processes and data quality issues helps teams make informed decisions about their analytics investment.
About Mammoth Analytics
Mammoth is a platform for preparing data and publishing dashboards from it, without code. Preparation is recorded as you work, so it re-runs on new data instead of being redone.
Mammoth vs Power BI, side by side →
Compare Power BI alternatives →
Fix your messy data without writing code
Mammoth cleans and reshapes data, then keeps it that way on a schedule. Use it as the preparation layer for Power BI, or publish dashboards from it directly.