How to Automate Excel Reports: 4 Ways, and Where Each One Stops
Four ways to automate Excel reports: Power Query, macros, Office Scripts with Power Automate, and Mammoth. What each one automates, and what it leaves to you.

Updated · 8 min read
The short answer
Power Query refreshes a report's data, but only while Excel has the file open. Macros repeat your steps, but only in desktop Excel. Office Scripts with Power Automate run on a schedule, but Microsoft says a scheduled script can't refresh Power Query data. Mammoth runs the whole report outside Excel: it pulls the new data, applies your saved steps and emails the result as an Excel file, daily, weekly or monthly.
AI dashboards built from your own data.


Most weekly Excel reports go the same way. You export the data, paste it in, fix the columns, refresh the pivot and email it to six people. One of them replies asking for last week's version.
There are four ways to automate that. Three are built into Microsoft 365: Power Query, macros, and Office Scripts with Power Automate. Each handles part of the job. The fourth is Mammoth, which handles all of it: it fetches the data, cleans it, does the sums and emails the finished Excel file on a schedule.
This guide shows how to set up each one, and what each one still leaves to you.
The Four Jobs in a Weekly Report
Before comparing tools, it helps to break the report into its parts. Almost every recurring report comes down to four jobs:
- 1. Get the dataYouYou
- 2. Clean itYouYou
- 3. Do the sumsYouYou
- 4. Send itYouYou
A report is only automated when all four run without you. That's the test for each method below, starting with the one you already have.
Way 1: Power Query
- 1. Get the dataAutomaticAutomatic
- 2. Clean itAutomaticAutomatic
- 3. Do the sumsAutomaticAutomatic
- 4. Send itYouYou
If you have Excel, you already have Power Query, so it's the easiest place to start. You connect it to a source, like a folder of files or a database, and clean the data in its editor. It saves each step. Next week, one click on Refresh repeats every step on the new data.
How to set it up:
- Go to Data > Get Data and pick your source.
- Clean the data in the Power Query editor. Each step is saved as you go.
- Load the result to a sheet, and build your formulas and pivots on top.
- Open Data > Queries & Connections, right-click the query and choose Properties.
- On the Usage tab, tick Refresh data when opening the file, or tick Refresh every and set the minutes.
Those settings are in Microsoft's refresh guide.
Where it stops
Power Query only refreshes while Excel has the file open. A closed file stays as it was, and Power Query never sends anything to anyone.
Open in Excel
Refreshed just now
Closed in a folder
Last refreshed Mon 27 Oct
So Power Query takes care of the data, but someone still has to open the file and send it. A macro can take over that last part.
Way 2: Macros
- 1. Get the dataPartly
- 2. Clean itAutomaticAutomatic
- 3. Do the sumsAutomaticAutomatic
- 4. Send itAutomaticAutomatic
A macro records your clicks and plays them back. That means it can do the jobs Power Query can't, like formatting the sheet, saving a dated copy and emailing it through Outlook.
How to set it up:
- Turn on the Developer tab in Excel's options.
- Click Record Macro, build the report once, then stop recording.
- Run it from Developer > Macros, or give it a button.
Where it stops
Macros only run in desktop Excel. Microsoft says you can't run them in Excel for the web. To run one on a timer, you need a computer that stays on with Excel installed.
Recorded macros also work on fixed cells. If next month's export has an extra column, the macro uses the wrong one, and it doesn't warn you.
October export
| ARegion | BSales | CUnits |
|---|---|---|
| North | 2,140 | 310 |
| South | 1,620 | 244 |
| West | 1,220 | 198 |
Macro totals column B: 4,980
November export, one new column
| ARegion | BChannel | CSales | DUnits |
|---|---|---|---|
| North | Online | 2,310 | 322 |
| South | Stores | 1,705 | 251 |
| West | Online | 1,290 | 203 |
Same macro, column B: 0. No error.
Both of these methods need Excel running somewhere. If you want the report to run with every file closed, Microsoft's answer is Office Scripts with Power Automate.
Way 3: Office Scripts with Power Automate
- 1. Get the dataYouYou
- 2. Clean itAutomaticAutomatic
- 3. Do the sumsAutomaticAutomatic
- 4. Send itAutomaticAutomatic
Office Scripts are the online version of macros, and they're the method most guides recommend. You record them on the Automate tab in Excel for the web. Power Automate then runs the script on a schedule, with the file closed, and can email the result.
How to set it up:
- Open the workbook from OneDrive or SharePoint and go to Automate > Record Actions.
- Do the report steps, then save the script.
- In Power Automate, create a scheduled flow with a Recurrence trigger.
- Add the Excel Online (Business) action Run script, and pick your workbook and script.
- Add an email step that sends the file or a link to it.
Microsoft's integration guide walks through each step.
The catch most guides skip
A scheduled script can't fetch new data. Microsoft's troubleshooting page says Office Scripts "can't refresh most data when run in Power Automate." Pivot table refresh does nothing, and data connections only refresh when Power BI is the source.
The flow still reports success. So it sends the report on time, with the same numbers as last week.
Flow run history
- Mon 20 Oct, 06:00 Succeeded
- Mon 27 Oct, 06:00 Succeeded
- Mon 3 Nov, 06:00 Succeeded
The report it sent
- Orders this week1,284
- Orders this week1,284
- Orders this week1,284
Same number, three weeks running.
Microsoft's platform limits page lists the other limits:
- Licence
- A business Microsoft 365 plan and OneDrive for Business.
- Time
- Each script run inside a flow stops after 120 seconds.
- Volume
- 1,600 script runs per person per day.
- Size
- 5MB of data per call to the workbook.
That's as far as Microsoft 365 goes on its own. Each method automates part of the report, but none of them fetches new data, cleans it, does the sums and sends it without someone stepping in. That's the gap Mammoth fills.
Way 4: Mammoth
- 1. Get the dataAutomaticAutomatic
- 2. Clean itAutomaticAutomatic
- 3. Do the sumsAutomaticAutomatic
- 4. Send itAutomaticAutomatic
Mammoth takes the whole report out of Excel. You build the steps once, much like you would in Power Query, and Mammoth runs them on a schedule: it fetches the new data, applies your steps and emails the finished Excel file. I work on Mammoth, so here is exactly how it works.
In
- Email inbox
- OneDrive
- Database
Mammoth
- 1Remove the totals row
- 2Fix the headers
- 3Join on Order ID
Every Monday, 06:00
Out
- Email, Excel attached
- Dashboard
- SharePoint
Setting it up takes four steps:
- Connect your data. Upload an Excel or CSV file, or connect Google Sheets, OneDrive, SharePoint, Google Drive, Dropbox or a database. Mammoth can also watch an email inbox and import the Excel and CSV files people send to it.
- Clean it and do the sums. Filter, fix headers, join files on an ID, and add formulas, pivots and totals. Mammoth saves each step and repeats it on every new file.
- Set the refresh. Choose how often Mammoth fetches new data. How often you can run it depends on your plan, and the pricing page lists each one.
- Email the result. Add an email export, pick up to 50 teammates, and choose Excel as the file type. It sends daily, weekly or monthly, or every time the data updates.
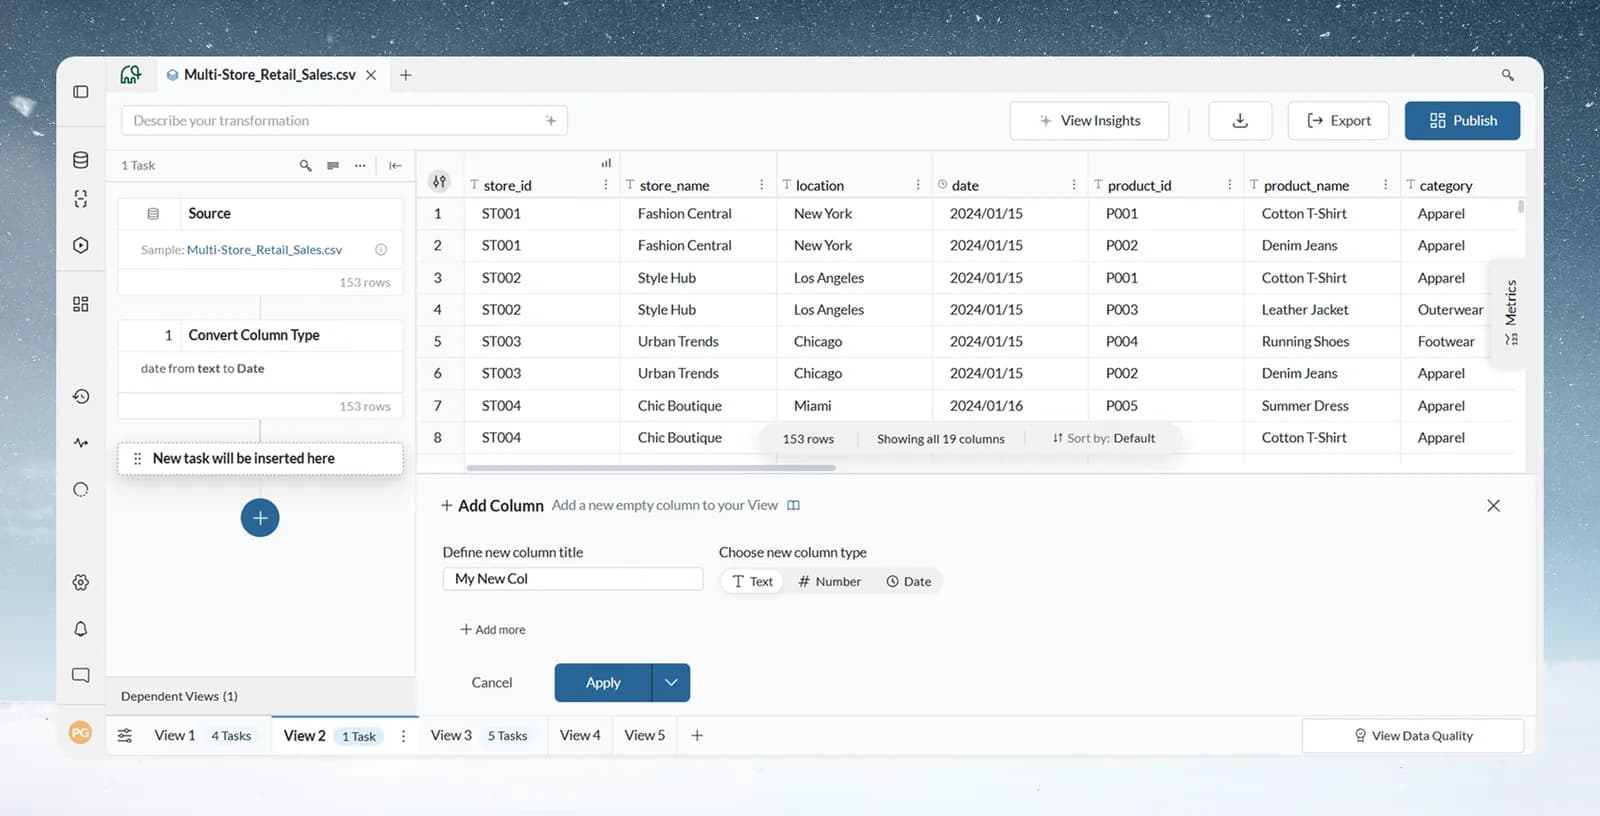
There's also a safety net the Excel methods don't have. If a new file arrives with different columns, Mammoth stops the refresh, keeps the last good data and shows you what changed in Monitor. So the report never goes out with numbers in the wrong columns.
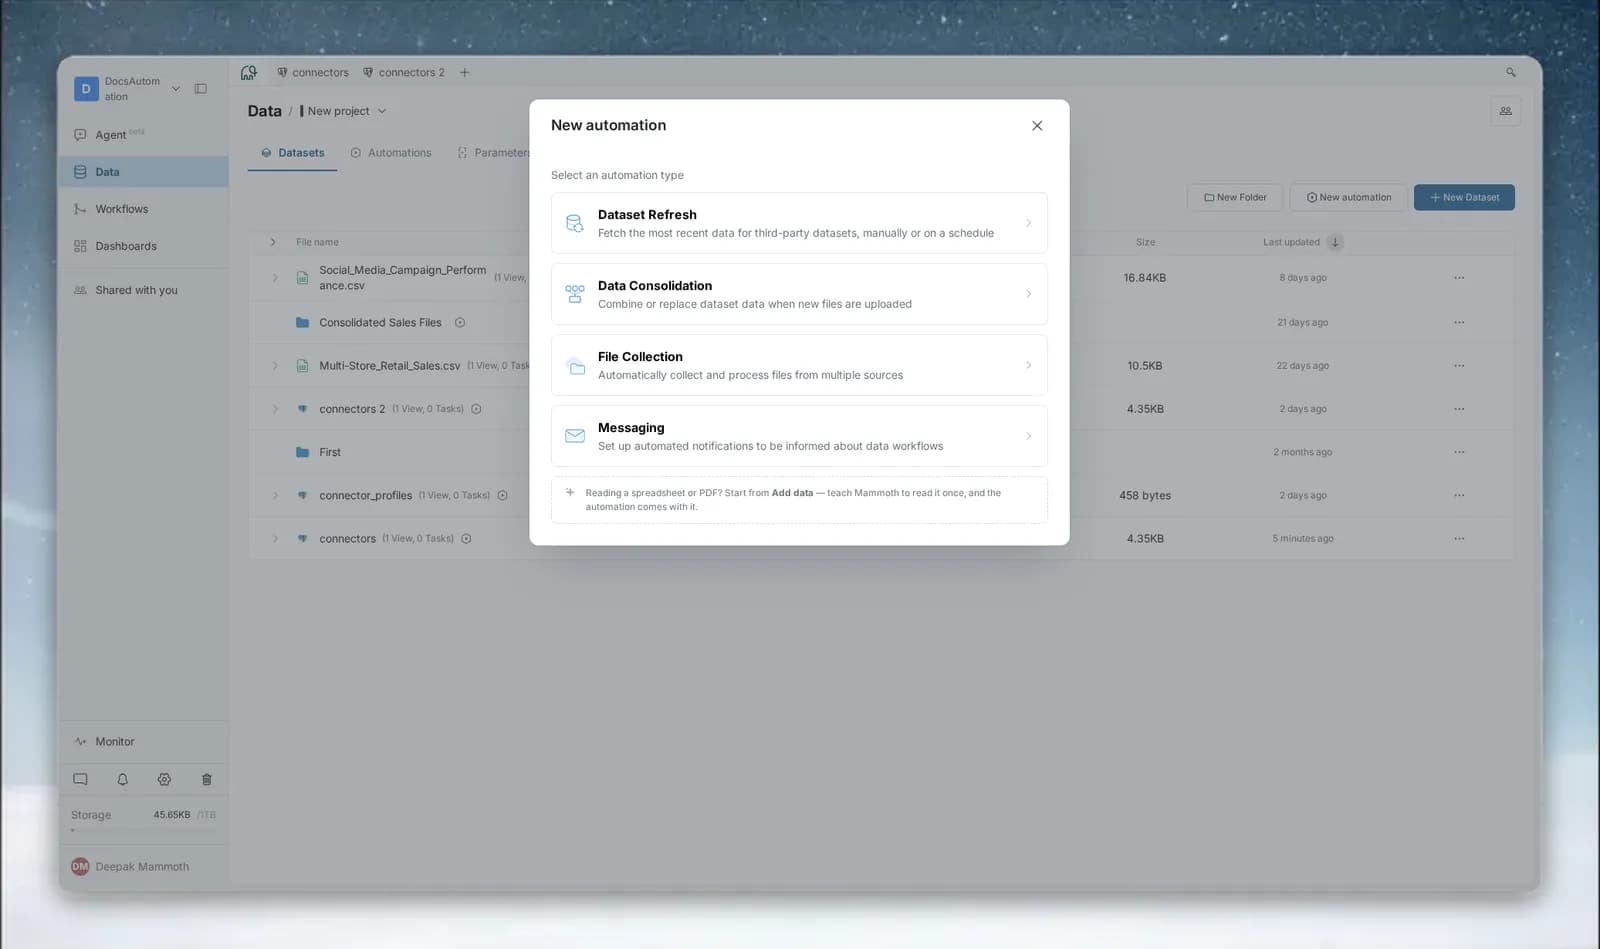
Email isn't the only way out, either. You can keep a dashboard up to date for people to open, write the data to SharePoint, OneDrive, Google Sheets or a database, or download a dashboard as a PDF or PowerPoint.
Good to know
The emailed Excel file holds up to 50,000 rows, and it goes to people in your Mammoth workspace. It's your data, not a copy of your workbook's layout. If the report needs your own colours and layout, keep that template in Excel and point it at the clean data.
All Four Ways Side by Side
Here's how the four methods compare, job by job:
None of the Microsoft methods covers all four jobs, and each one misses a different piece. Power Query can't send, macros need a computer left on, and Office Scripts can't fetch new data. That's why so many teams chain them together, and why the chain breaks when one piece changes. Mammoth is the only one of the four that covers all four jobs and runs on its own.
Which Way Should You Use?
Each method is the right answer for some reports. Here's how to pick:
- If
One report, for you, and the data already sits in a folder.
Use Power Query
- If
You need formatting or emailing, and it can run on your own computer.
Use a macro
- If
The file lives in OneDrive and only needs reformatting and sending. No new data.
Use Office Scripts with Power Automate
- If
New data every week, from more than one place, sent without anyone opening Excel.
Use Mammoth
Bring the Excel report you rebuild every week to a short call, and we'll show you how it would run on its own in Mammoth.
Frequently Asked Questions
Can Excel run a report automatically?
Partly. Power Query can refresh a report's data when the file opens, or every few minutes while it's open. To run with the file closed, you need Power Automate with Office Scripts, which needs a business Microsoft 365 plan and can't refresh Power Query data.
Can Power Automate refresh Power Query?
No. Microsoft says Office Scripts can't refresh most data when run in Power Automate. Refreshing data connections from a flow only works when Power BI is the source, and refreshing a pivot table does nothing.
Do macros work in Excel online?
No. You can't create, run or edit VBA macros in Excel for the web. Office Scripts are the web version.
How do I email an Excel report automatically?
In Excel, you need a macro that emails through Outlook, or a Power Automate flow with an email step. In Mammoth, add an email export to your data, pick the people, choose Excel as the file type and set it to send daily, weekly or monthly.
Can I automate Excel reports with Python?
Yes. Python libraries like pandas can read Excel files, clean the data and write a new workbook, and a scheduler can run the script every week. It works well if someone on the team writes and maintains code. If nobody does, the report stops the first time the script breaks.
Can AI automate Excel reports?
AI can write the automation for you, but it doesn't run it. A chat tool like ChatGPT can write a macro or an Office Script, and you still have to set it up and schedule it. In Mammoth, you can describe a step in plain words, check the step it builds, and save it. From then on it runs on the schedule with the rest of the report.
How do I turn on Automate in Excel?
The Automate tab shows up in Excel for the web, Windows and Mac when your account meets Microsoft's requirements, including a qualifying Microsoft 365 plan and OneDrive for Business. In Excel for the web, your browser also needs third-party cookies switched on. If the tab still doesn't appear, your admin may have turned Office Scripts off.
More on reporting: the best tools for automated reports and financial reporting automation.


