9 Best Tableau Alternatives for 2026 (Sorted by Job)
The best Tableau alternatives are Mammoth, Power BI, Looker Studio, Metabase, Qlik Sense, ThoughtSpot, Sigma, Looker and Apache Superset, sorted by the job each one does best.

Updated · 11 min read
The short answer
Pick by the reason you're leaving Tableau. If it's the bill, Power BI Pro is $14 a user a month and Looker Studio and Apache Superset are free. If it's the training, ThoughtSpot and Mammoth let people ask for what they want in plain language. If it's the prep work before every chart, Mammoth cleans and joins the data in the same product. If your data already lives in a cloud warehouse, look at Sigma and Looker.
AI dashboards built from your own data.


Table of contents
- The nine Tableau alternatives at a glance
- What Tableau is, and why teams leave it
- 1. Mammoth Analytics: best Tableau alternative when the data needs cleaning first
- 2. Power BI: best Tableau alternative for Microsoft shops
- 3. Looker Studio: best Tableau alternative for free dashboards on Google data
- 4. Metabase: best Tableau alternative for small teams who want it simple
- 5. Qlik Sense: best Tableau alternative for exploring data across many sources
- 6. ThoughtSpot: best Tableau alternative for plain-language questions
- 7. Sigma: best Tableau alternative for spreadsheet users on a cloud warehouse
- 8. Looker: best Tableau alternative for governed metrics on a warehouse
- 9. Apache Superset: best free Tableau alternative for engineers who self-host
- How to choose a Tableau alternative
- How to switch from Tableau without losing your reports
- Frequently Asked Questions
Tableau alternatives are tools that do the job Tableau does: they turn your data into charts and dashboards that other people can read. Some do it for less money, some need less training, and a few take on work Tableau leaves to you, like cleaning the data before it becomes a chart.
I sorted nine of them by the job each one does best, and I checked every price on the vendor's own pricing page on 2 November 2026. Full disclosure: Mammoth is our product, and it's on the list.
The nine Tableau alternatives at a glance
| Tool | Best for | Starts at |
|---|---|---|
| Mammoth | Data that needs cleaning first | Free, then $39/month billed annually |
| Power BI | Microsoft shops | $14 a user a month, paid yearly |
| Looker Studio | Free dashboards on Google data | Free |
| Metabase | Small teams who want it simple | Free to self-host, or $100 a month for 5 users |
| Qlik Sense | Exploring data across many sources | $300 a month for 10 users, billed annually |
| ThoughtSpot | Plain-language questions | $25 a user a month, billed annually |
| Sigma | Spreadsheet users on a cloud warehouse | Not published |
| Looker | Governed metrics on a warehouse | Not published |
| Apache Superset | Engineers who want to self-host | Free |
What Tableau is, and why teams leave it
Tableau is a visual analytics tool, owned by Salesforce. An analyst who knows it well can build almost any chart you can describe, and that depth is why it's still on most shortlists.
The reasons people leave are rarely about the charts. They're about what it takes to get to them.
The licence count grows with the audience. Tableau Cloud is sold per user on an annual contract. Standard starts at $15 a user a month and Enterprise at $35, and every deployment needs at least one Creator licence, the role that builds. Tableau's pricing page doesn't list the Creator or Explorer price, so $15 is the floor rather than the bill. Even at the floor, 100 people who only read the dashboards cost $18,000 a year. Count your viewers. My Tableau pricing breakdown walks through the editions.
Renewals have gone up. In August 2023 Salesforce raised prices on Tableau's legacy on-premises subscriptions by 9% to 33%, according to a Gartner research note reported by CFO Dive. Gartner read it as a push to move customers to the cloud, and renewals are where a team usually finds out.
The data has to be ready first. Tableau charts the data it's given. Cleaning and joining happen in Tableau Prep Builder, which comes with Standard, while the Data Management tools that schedule Prep flows come with Enterprise. Teams whose numbers arrive split across exports spend their week before the chart, not in it.
Someone has to know the tool. Building in Tableau is analyst work. That's fine if you have the analysts. It's a bottleneck if one person builds for everybody.
1. Mammoth Analytics: best Tableau alternative when the data needs cleaning first
Most suitable for: teams whose data needs work before it can become a dashboard, and who want the whole company to read it.
Mammoth Analytics connects to your sources, cleans and joins the data in a visual pipeline with no SQL, and builds dashboards on the result. The Data Engine and the dashboards are one product, so the prep Tableau sends to a separate tool happens on the same canvas, and it re-runs on a schedule.
You build a dashboard by describing what you want in plain language. The model never writes a number: it plans the query, and the values are computed from your data.
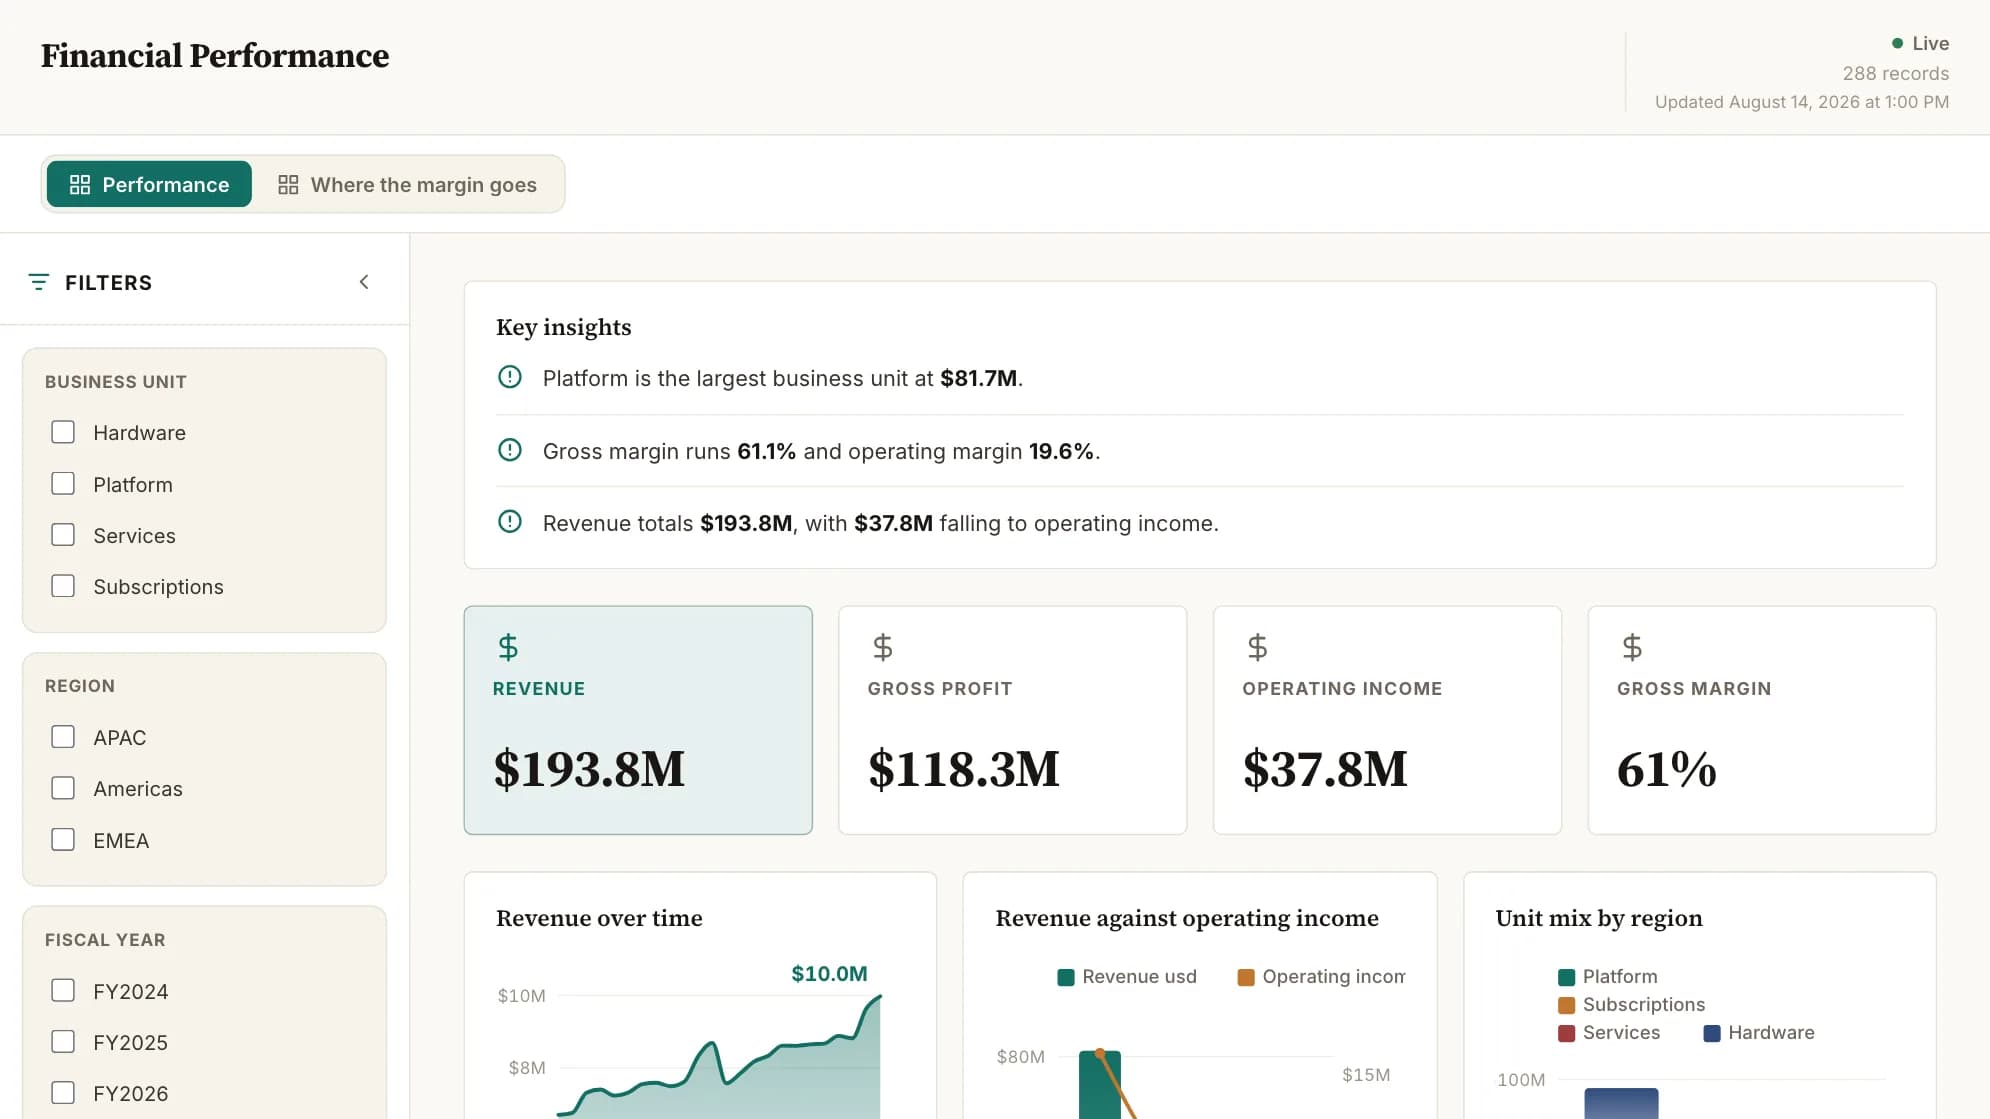
The difference that matters most against Tableau is who pays. Dashboard viewers are free on every Mammoth plan, so sharing with 200 people costs the same as sharing with two. The Team plan is $1,788/year for 5 builders, billed annually, plus the storage size you pick. The Free plan gives one builder three dashboards, refreshed by hand.
If you're switching, you can upload a Tableau workbook (.twb or .twbx). Mammoth reads what it was asking about, its measures and the dimensions it cuts by, and builds a Mammoth version from that. It tells you up front what didn't come across. It builds on a fitted sample first, so you connect your own source to make it real.
Where Tableau is better: open-ended visual exploration. An analyst whose main job is digging through data with full control over every chart and layout will find Tableau deeper. The Mammoth vs Tableau comparison sets out both sides.
2. Power BI: best Tableau alternative for Microsoft shops
Most suitable for: companies that already run on Microsoft 365 and Azure.
Power BI is Microsoft's business intelligence tool. It builds reports in a desktop app, shares them through the Power BI service, and fits into Teams, Excel and SharePoint.
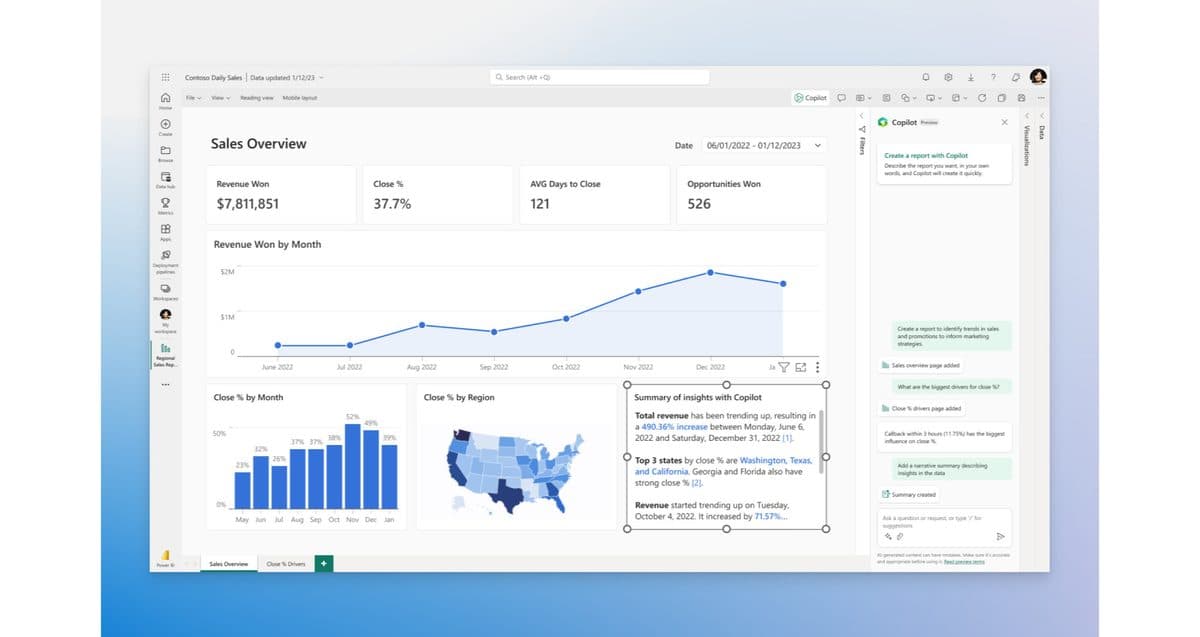
It's the cheapest per-user licence on this list among the big names. Power BI Pro is $14 a user a month and Premium Per User is $24, both paid yearly. Power Query handles cleaning inside the tool, which covers more prep than Tableau does without a second product.
The catch is the same shape as Tableau's: licensing is per user, so the bill grows with the number of people who need the report. My Power BI pricing guide covers where Fabric capacity starts to make more sense.
3. Looker Studio: best Tableau alternative for free dashboards on Google data
Most suitable for: marketing teams reporting on Google Analytics, Google Ads, Sheets and BigQuery.
Looker Studio is Google's free web-based dashboard tool, formerly called Data Studio. It connects natively to Google's own products and to many others through partner connectors, and anyone with a link can view a report.
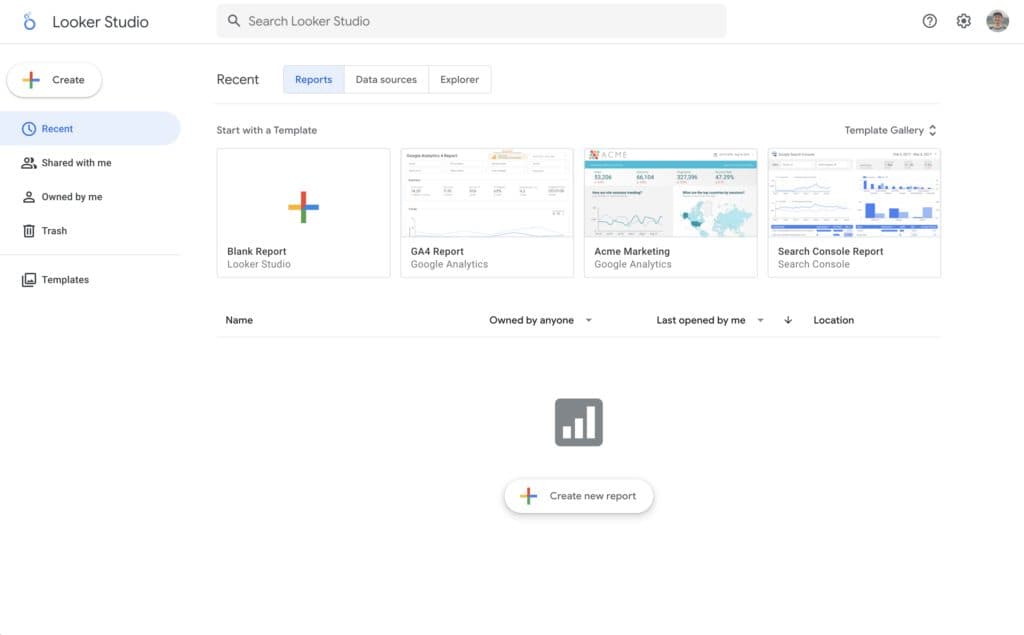
It's free. For Google data it's also quick to set up, because the connectors to Analytics, Ads, Sheets and BigQuery are Google's own and need no extra account. It gets slow on large datasets, and blending data from several sources is limited compared with Tableau. Looker Studio pricing covers the paid Pro tier and the connector costs that sit around a free tool.
4. Metabase: best Tableau alternative for small teams who want it simple
Most suitable for: small teams with a database and someone who can run a server.
Metabase is an open-source BI tool. You point it at a database, and people ask questions through a point-and-click query builder or write SQL if they prefer.
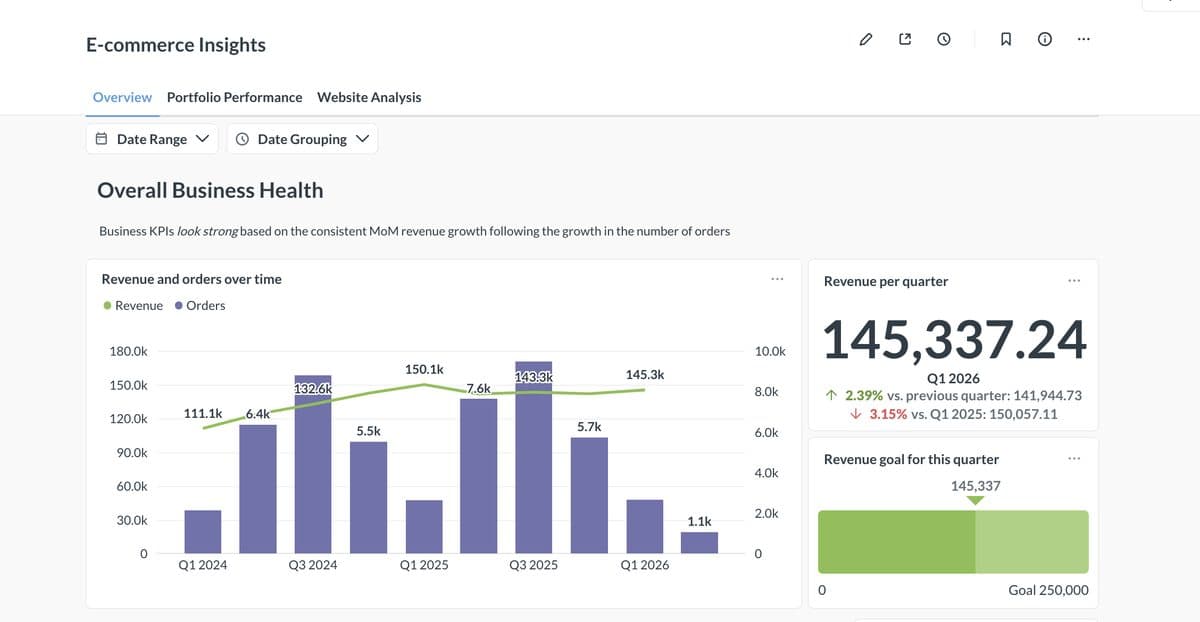
The open-source version is free with unlimited users, if you host it yourself. The hosted Starter plan is $100 a month with the first 5 users included and $6 a month for each one after. Pro is $575 a month with 10 users included and $12 for each extra. Pricing like that stays cheap for a long time compared with per-seat Tableau.
It does less than Tableau on visual depth, and it expects your data to be tidy already. Metabase pricing explains how embedding changes the bill.
5. Qlik Sense: best Tableau alternative for exploring data across many sources
Most suitable for: analysts who explore across many joined sources rather than building fixed reports.
Qlik Sense is a BI tool built on what Qlik calls its associative engine. When you select a value, everything related to it lights up and everything unrelated greys out, across all the data you've loaded. That makes it good at finding the relationship you didn't think to ask about.
Qlik Cloud Analytics Starter is $300 a month for 10 users, billed annually. Standard starts at $825 a month and is priced on data volume, starting at 25 GB, rather than on seats. The interface takes time to learn, which matters if you're leaving Tableau because of training. More in Qlik Sense pricing.
6. ThoughtSpot: best Tableau alternative for plain-language questions
Most suitable for: business users who want to ask a question and get a chart back.
ThoughtSpot is a search-led analytics tool. Instead of building a chart, you type a question in plain language and it answers with one.
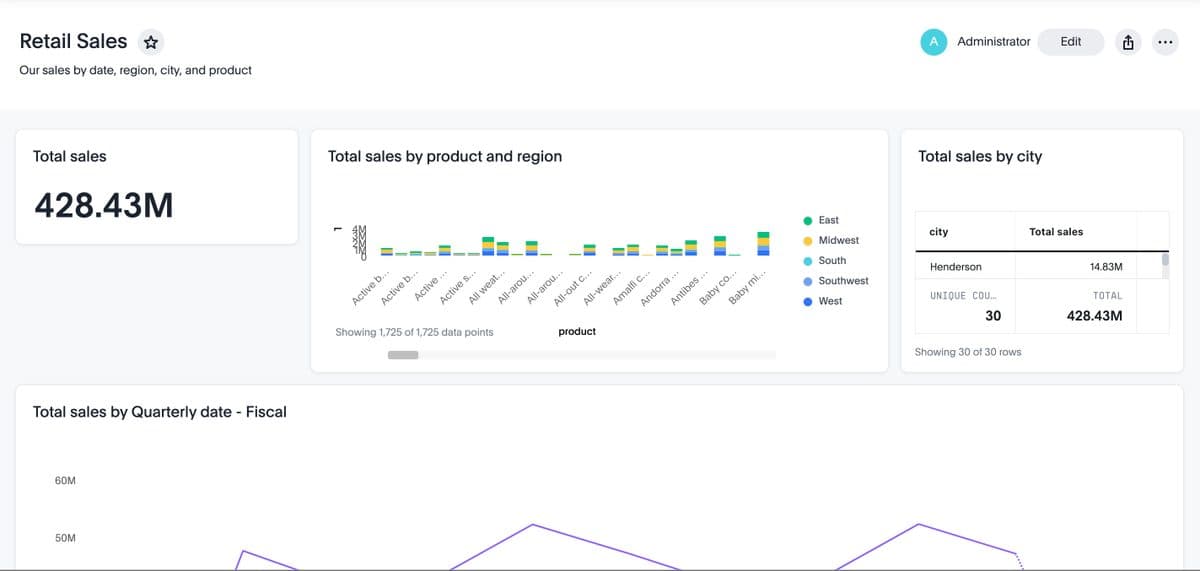
Essentials starts at $25 a user a month and Pro at $50, both billed annually, and there's a free trial. It's at its best sitting on a cloud data warehouse that someone has already modelled, so the plain-language part works for readers only after the data work is done by somebody else. ThoughtSpot pricing has the usage-based option.
7. Sigma: best Tableau alternative for spreadsheet users on a cloud warehouse
Most suitable for: finance and operations teams who think in spreadsheets and whose data sits in Snowflake, BigQuery or Databricks.
Sigma gives you a spreadsheet-style interface on top of your cloud data warehouse. People write formulas they already know, and Sigma turns them into queries that run in the warehouse, so nobody downloads an extract.
Sigma doesn't publish prices. There's a free trial. It only makes sense if you have a cloud warehouse, because without one there's nothing for it to sit on and nothing for its formulas to query.
8. Looker: best Tableau alternative for governed metrics on a warehouse
Most suitable for: data teams who want every metric defined once and used everywhere.
Looker is Google Cloud's enterprise BI platform, a separate product from Looker Studio. Developers define metrics in a modelling language called LookML, and every report uses those definitions, so "revenue" means the same thing on every dashboard.
That consistency is the reason to choose it. It's also the cost, because someone has to write and maintain the LookML for as long as you use it. Google doesn't list a price on its Looker page, so expect a sales conversation. My Looker alternatives guide covers what teams move to when that modelling work gets too heavy.
9. Apache Superset: best free Tableau alternative for engineers who self-host
Most suitable for: engineering-led teams who'd rather run their own BI than pay for seats.
Apache Superset is an open-source BI tool from the Apache Software Foundation. It connects to most SQL databases and builds charts and dashboards in the browser.
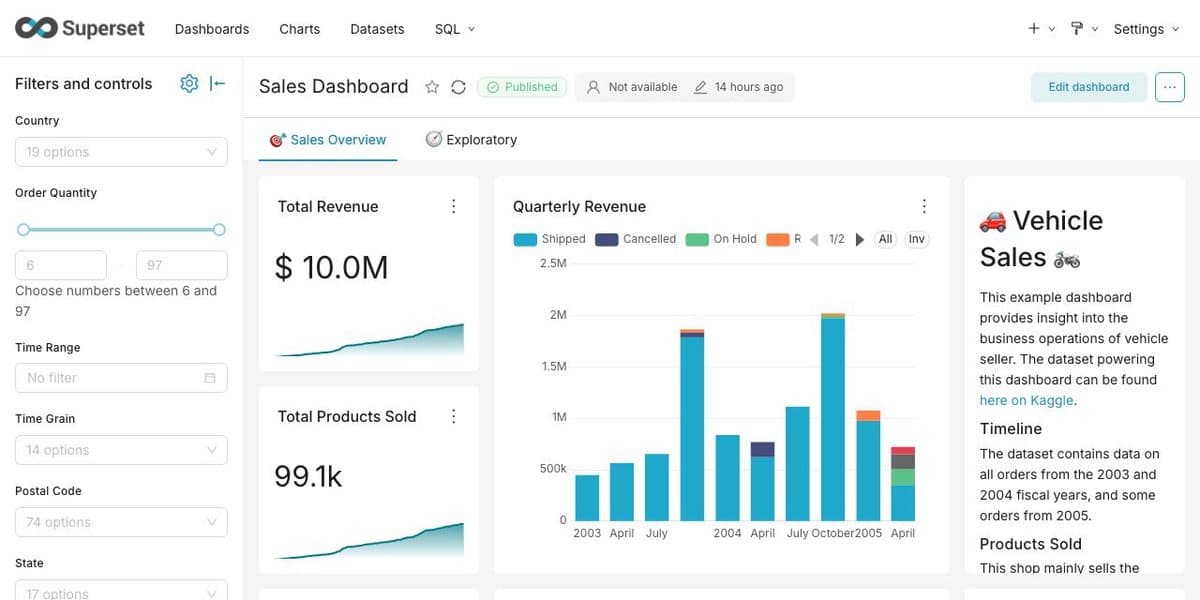
It's free. You host it, upgrade it and secure it yourself. Building anything beyond a simple chart usually means writing SQL, so it suits a team with engineers to spare rather than a business team trying to get out from under an analyst queue.
How to choose a Tableau alternative
Start from the reason you're leaving, because each tool on this list fixes a different one.
- The bill. Count your viewers. If most of your licences are for people who only read, a tool with free viewers (Mammoth) or a free tool (Looker Studio, Superset, self-hosted Metabase) changes the maths most.
- The training. If one analyst builds for everyone, look at tools where a business user can build: Mammoth, ThoughtSpot and Sigma.
- The prep. If the week goes on cleaning and joining exports before any chart exists, only Mammoth does that work in the same product. The others assume the data arrives ready, as Tableau does.
- The warehouse. If you already run Snowflake, BigQuery or Databricks with modelled data, Sigma and Looker are built for that setup.
Then test the shortlist on your messiest real dataset, not the vendor's sample. The gap between a clean demo and your own data is where most switches go wrong.
How to switch from Tableau without losing your reports
A switch goes best when it's done in a set order, with Tableau still running.
- List the workbooks people open. Most Tableau sites hold more workbooks than anyone reads. Rebuild only the ones in use.
- Fix the data source once. If the same cleaning happens inside several workbooks, move it into one pipeline that every dashboard reads from.
- Rebuild the most-used dashboard first. In Mammoth you can upload the workbook and start from what it was asking about.
- Run both side by side for a reporting cycle. Compare the numbers before anyone switches over.
- Move the viewers last, and start before your renewal notice period, since renewal is where the price goes up.
Frequently Asked Questions
Are companies moving away from Tableau?
Some are, mostly over cost, though there's no public count of how many. The pressure is documented: in August 2023 Salesforce raised prices on Tableau's legacy on-premises subscriptions by 9% to 33%, according to a Gartner note reported by CFO Dive.
Is Tableau still relevant in 2026?
Yes. It's still one of the most capable visual analysis tools you can buy, and Tableau skills are easy to hire for. The real question is whether your team needs that depth, or needs dashboards that more people can build and read.
Is Tableau going to be replaced by AI?
Not by Salesforce, which is adding AI to Tableau rather than retiring it. In April 2025 it announced Tableau Next, with AI agents for data prep and plain-language questions. What AI does change is who can build a dashboard: tools like Mammoth and ThoughtSpot let someone ask for one in plain language.
What is the cheapest alternative to Tableau?
Looker Studio and Apache Superset are free, and Metabase is free if you host it yourself. Among paid tools, Power BI Pro is $14 a user a month, paid yearly. Mammoth has a free plan, and dashboard viewers are free on every Mammoth plan.
Can I keep Tableau and still use Mammoth?
Yes. Mammoth can prepare the data and send it on to Tableau. PTI Digital does exactly that: its team unpacks an awkward ticketing API in Mammoth, blends it with past seasons and publishes it to Tableau through PostgreSQL.
Bring the export you spend the most time cleaning and see what comes back. No credit card needed.
Want to talk it through first? Talk to us about your setup.


