KPI dashboards
KPI dashboard examples
In short
What a KPI dashboard is
A KPI dashboard is a single screen showing an organisation's most important measures against their targets, so the gap between plan and actual can be read at a glance. Teams also call it a KPI scorecard. What separates it from a departmental dashboard is selection, not subject. Five to ten measures, each on the page because a decision hangs on it. The detail belongs to the boards underneath.
The examples
Six KPI dashboard examples
Real Mammoth templates on sample data. Every figure is illustrative. Six datasets, because a board binds one dataset and a ledger and a headcount file do not share a grain.
Example 01· Template: Financial KPI Scorecard
Finance KPI scorecard
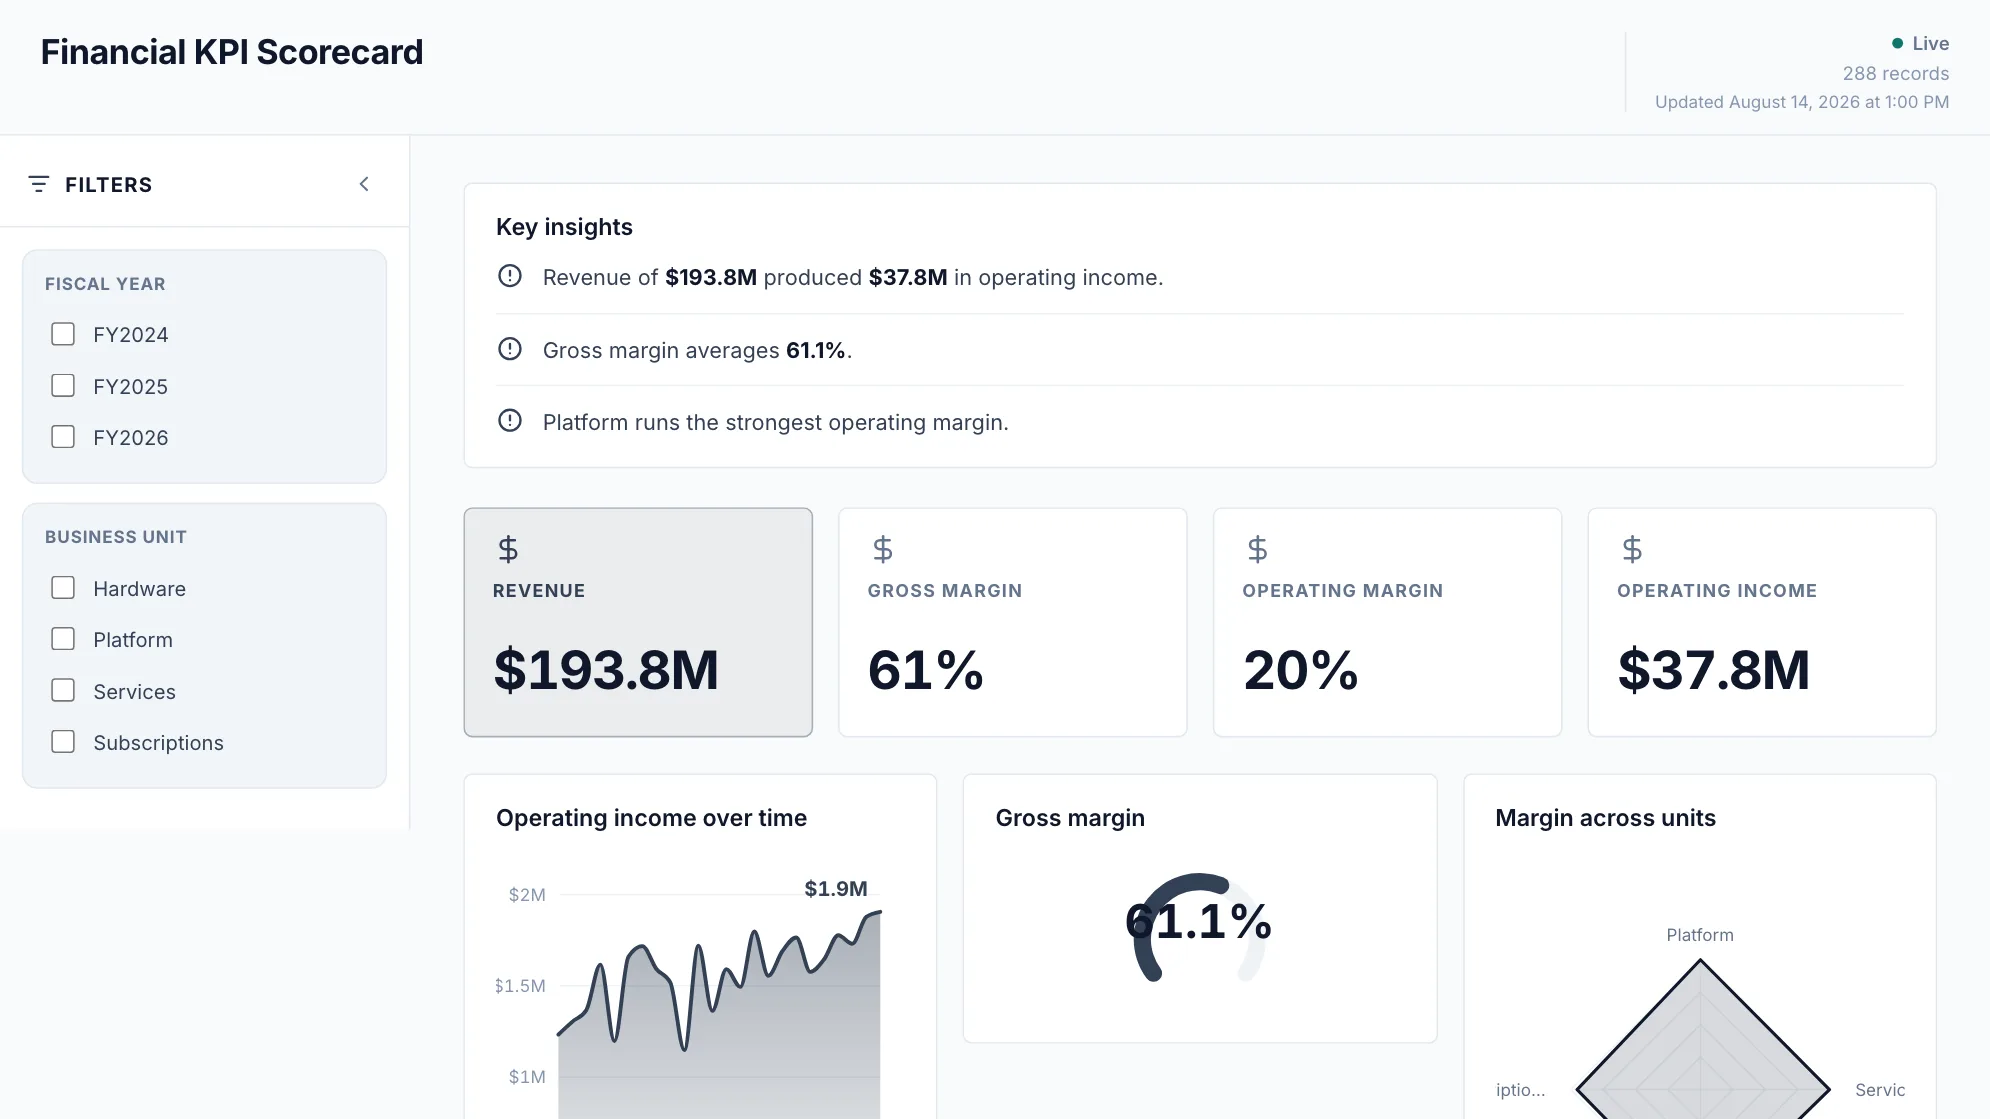
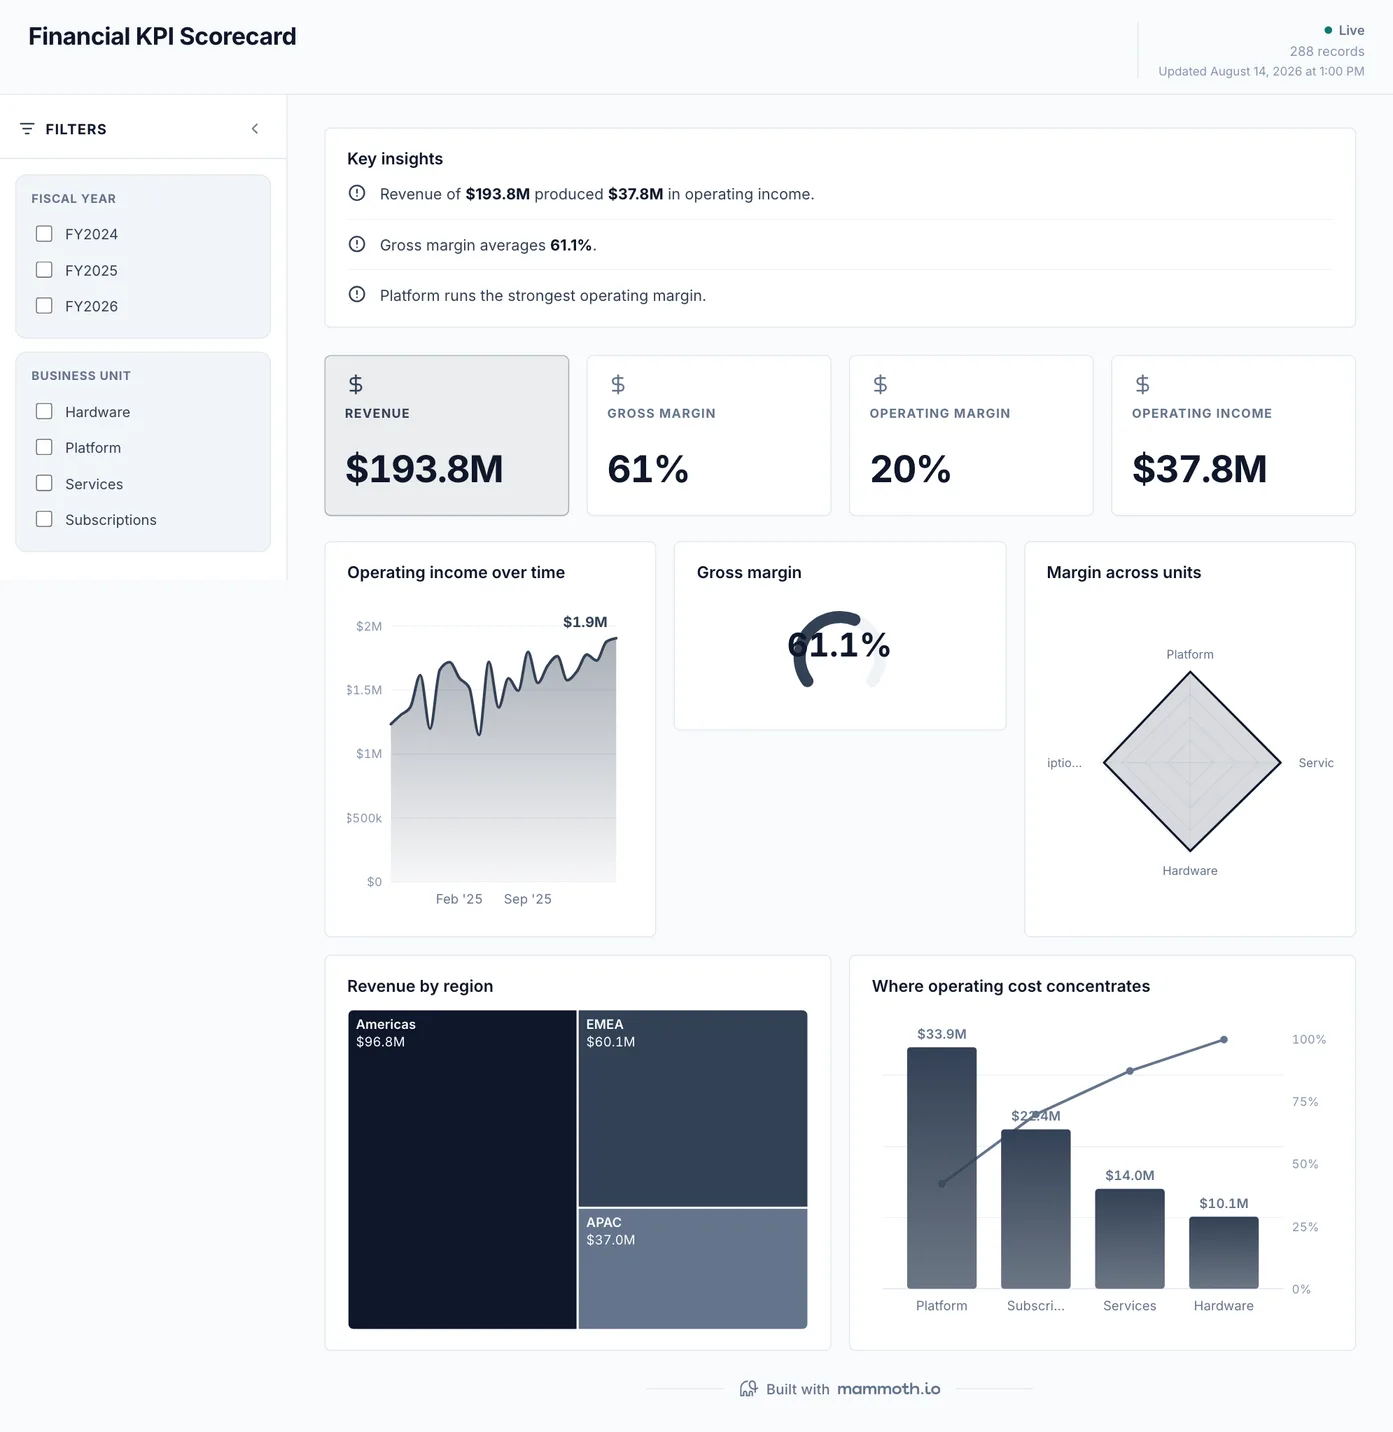
What are the four numbers a finance review opens with?
Revenue, gross margin, operating margin and operating income, each carrying its direction rather than a bare value. The cuts underneath say where the margin came from and where operating cost concentrates. So the question after the headline has an answer on the same screen.
What is on it
- Operating income over time
- Gross margin
- Margin across units
- Revenue by region
- Where operating cost concentrates
Your data needsDashboard
- a revenue or money column
- a category (~8 values)
Sample data: illustrative figures, not business results. Example 02· Template: Sales KPI Scorecard
Sales KPI scorecard
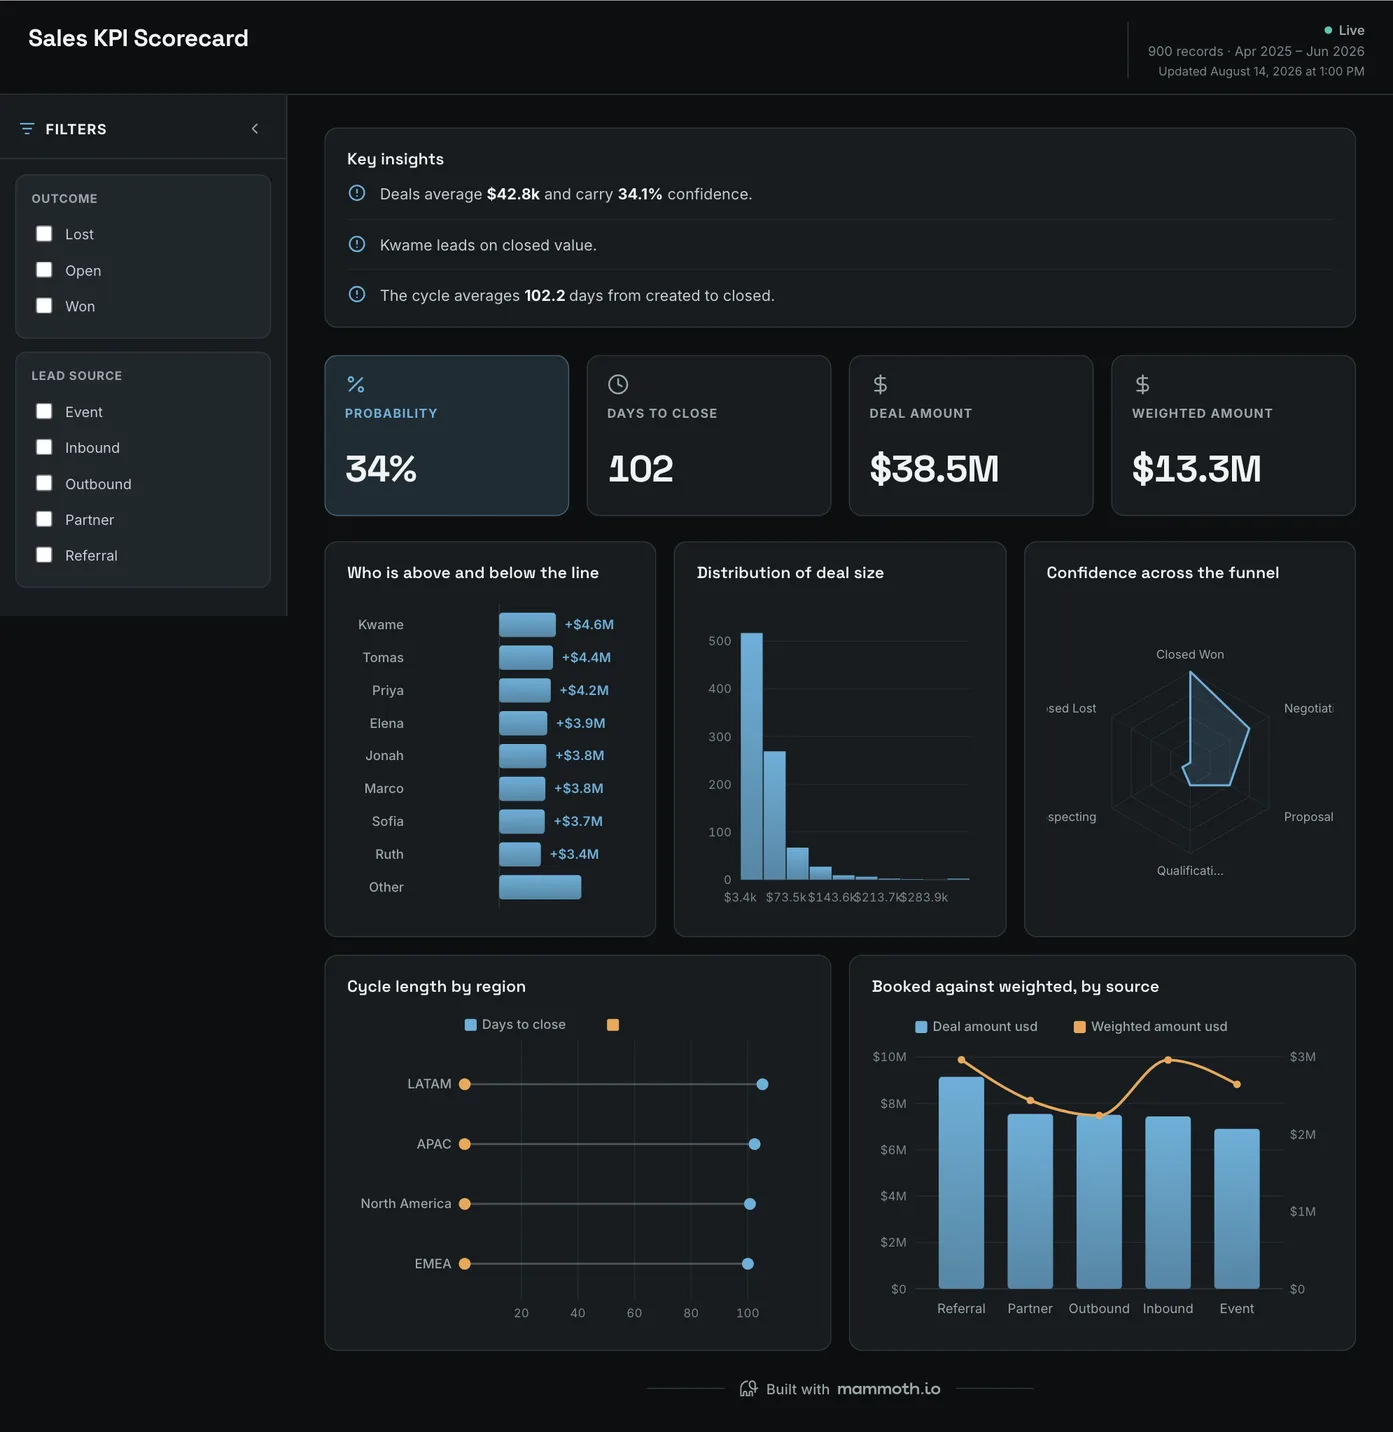
Is the book healthy, or only large?
Win probability by value, days to close, deal amount and weighted amount, with reps set above and below the line. Deal size runs as a spread rather than an average. A pipeline total can rise while the shape of the book gets worse, and an average hides the two deals holding up the quarter.
What is on it
- Who is above and below the line
- Distribution of deal size
- Confidence across the funnel
- Cycle length by region
- Booked against weighted, by source
Your data needsDashboard
- a revenue or money column
- a category (~3 values)
Sample data: illustrative figures, not business results. Example 03· Template: HR Scorecard
HR KPI scorecard
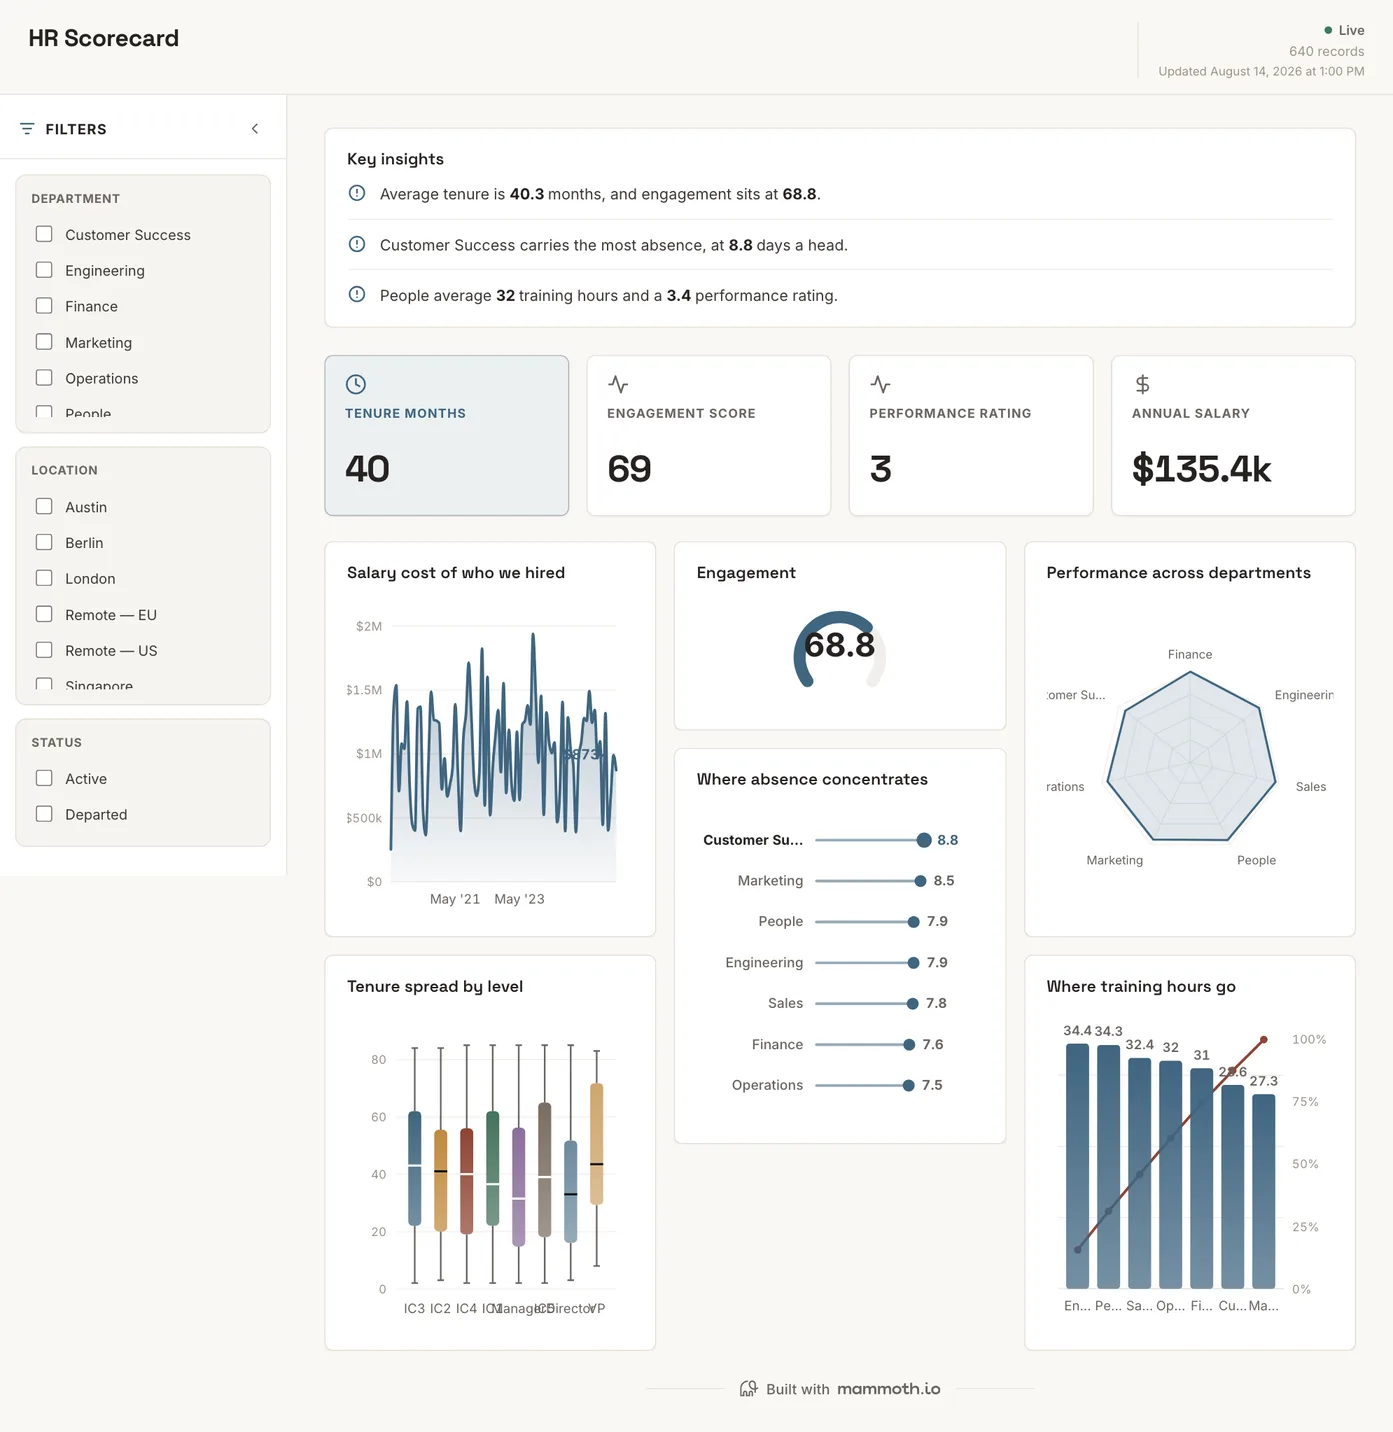
What are the people numbers behind the plan?
Tenure, engagement, performance rating and salary cost on one screen. Tenure runs as a spread by level. Absence and training hours are cut by where they concentrate. Headline attrition with no denominator invites the wrong reaction, so the population sits beside the rate.
What is on it
- Salary cost of who we hired
- Engagement
- Performance across departments
- Tenure spread by level
- Where absence concentrates
- Where training hours go
Your data needsDashboard
- a revenue or money column
- a category (~7 values)
Sample data: illustrative figures, not business results. Example 04· Template: Marketing Performance
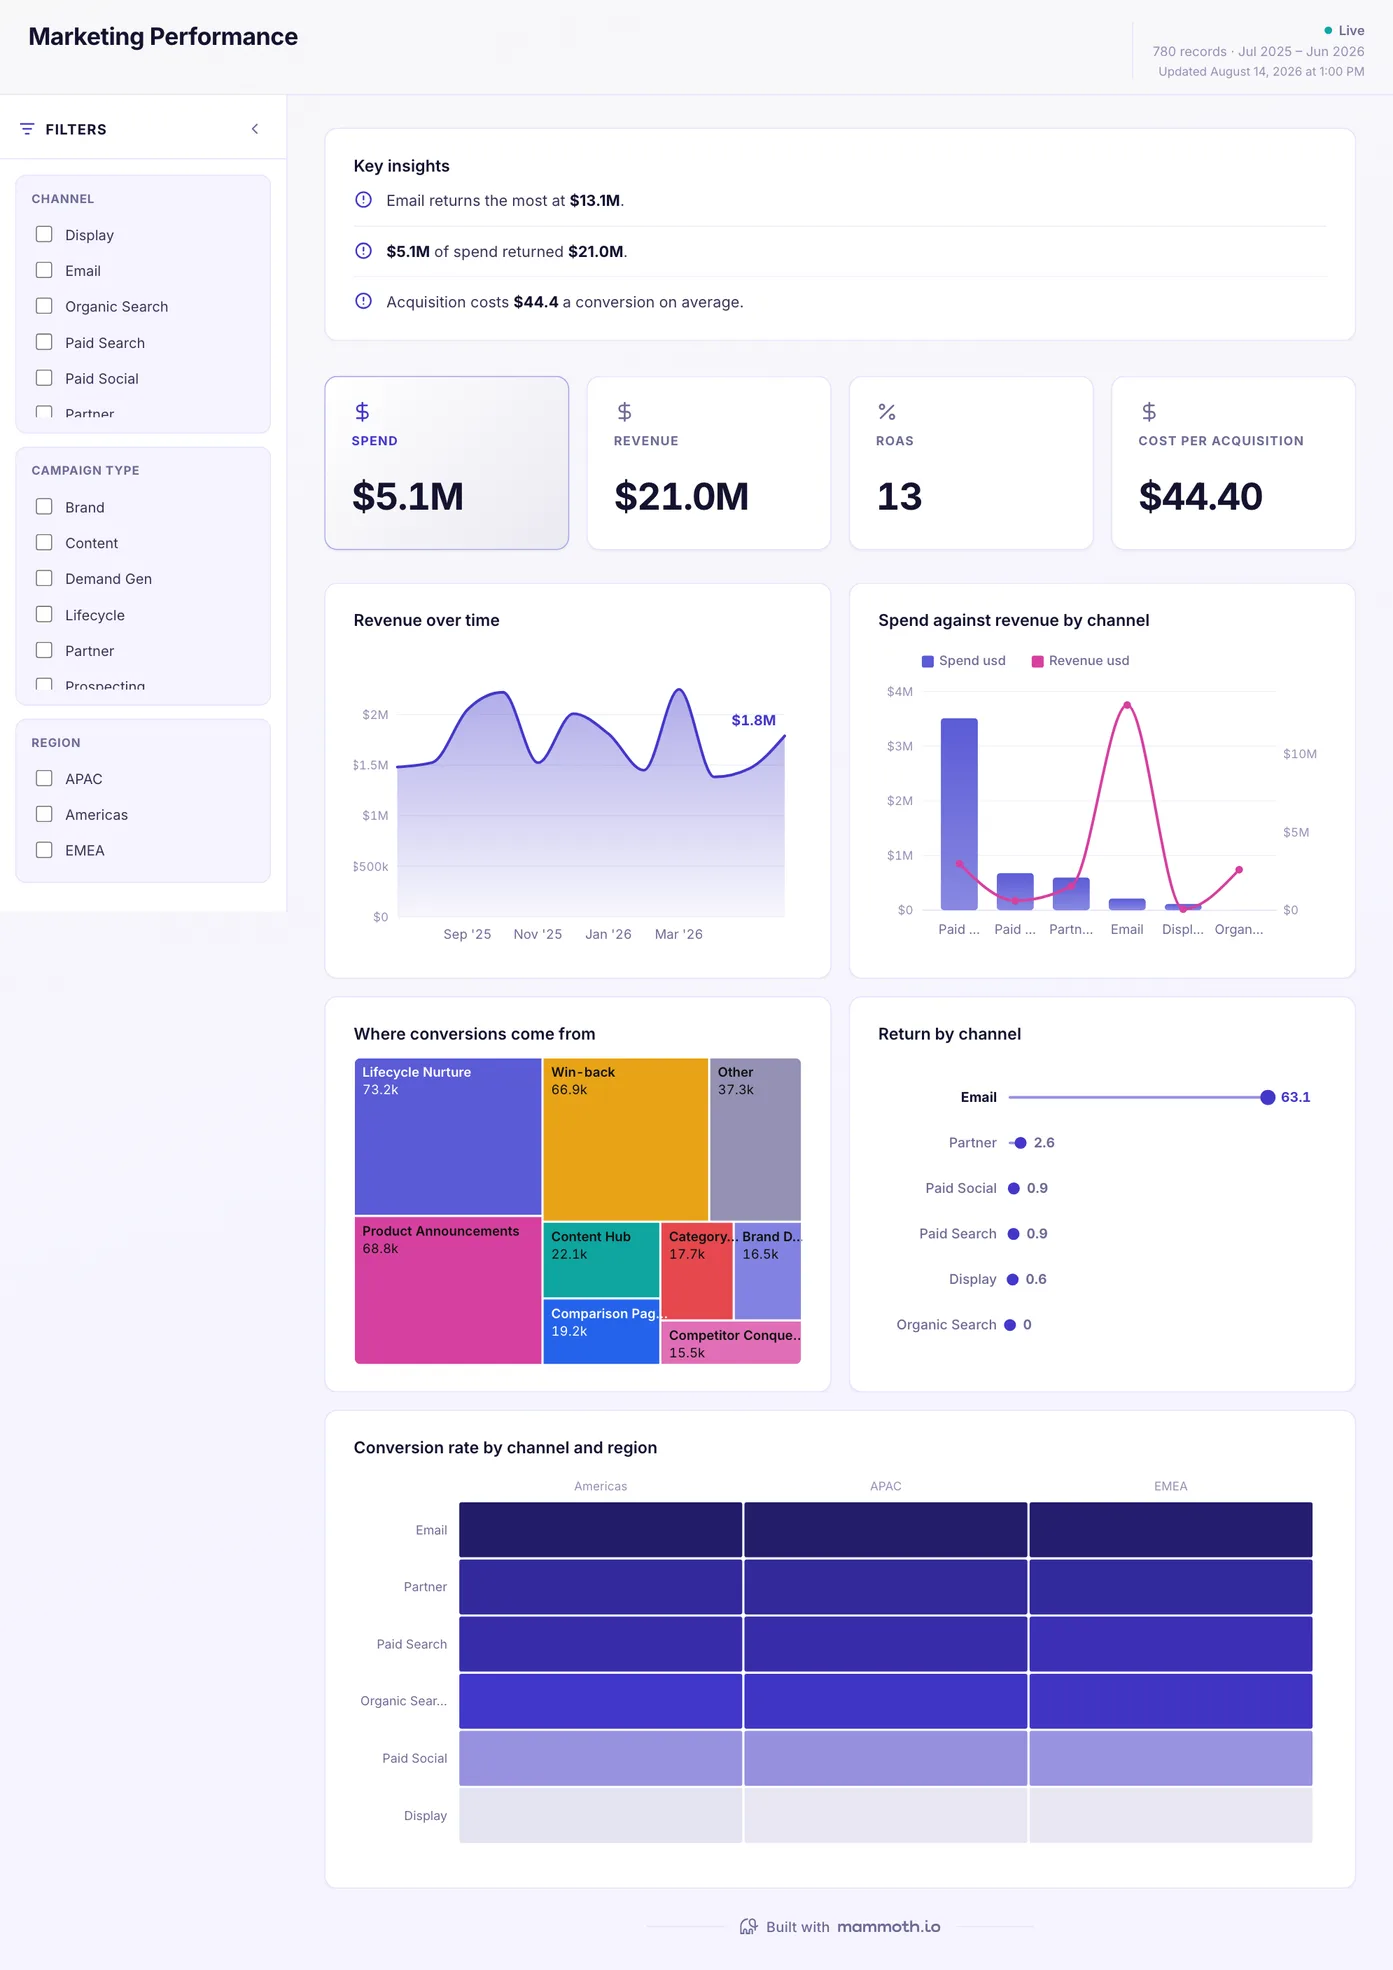
Marketing KPI dashboard
Which channels pay back, on four numbers?
Spend, revenue, return on ad spend and cost per acquisition on the strip, then the same four by channel and region. A marketing review opens on these because they are the four that resolve spend to an outcome; clicks and impressions are left to the boards underneath.
What is on it
- Revenue over time
- Spend against revenue by channel
- Where conversions come from
- Return by channel
- Conversion rate by channel and region
Your data needsDashboard
- a revenue or money column
- a category (~6 values)
Sample data: illustrative figures, not business results. Example 05· Template: SaaS Metrics
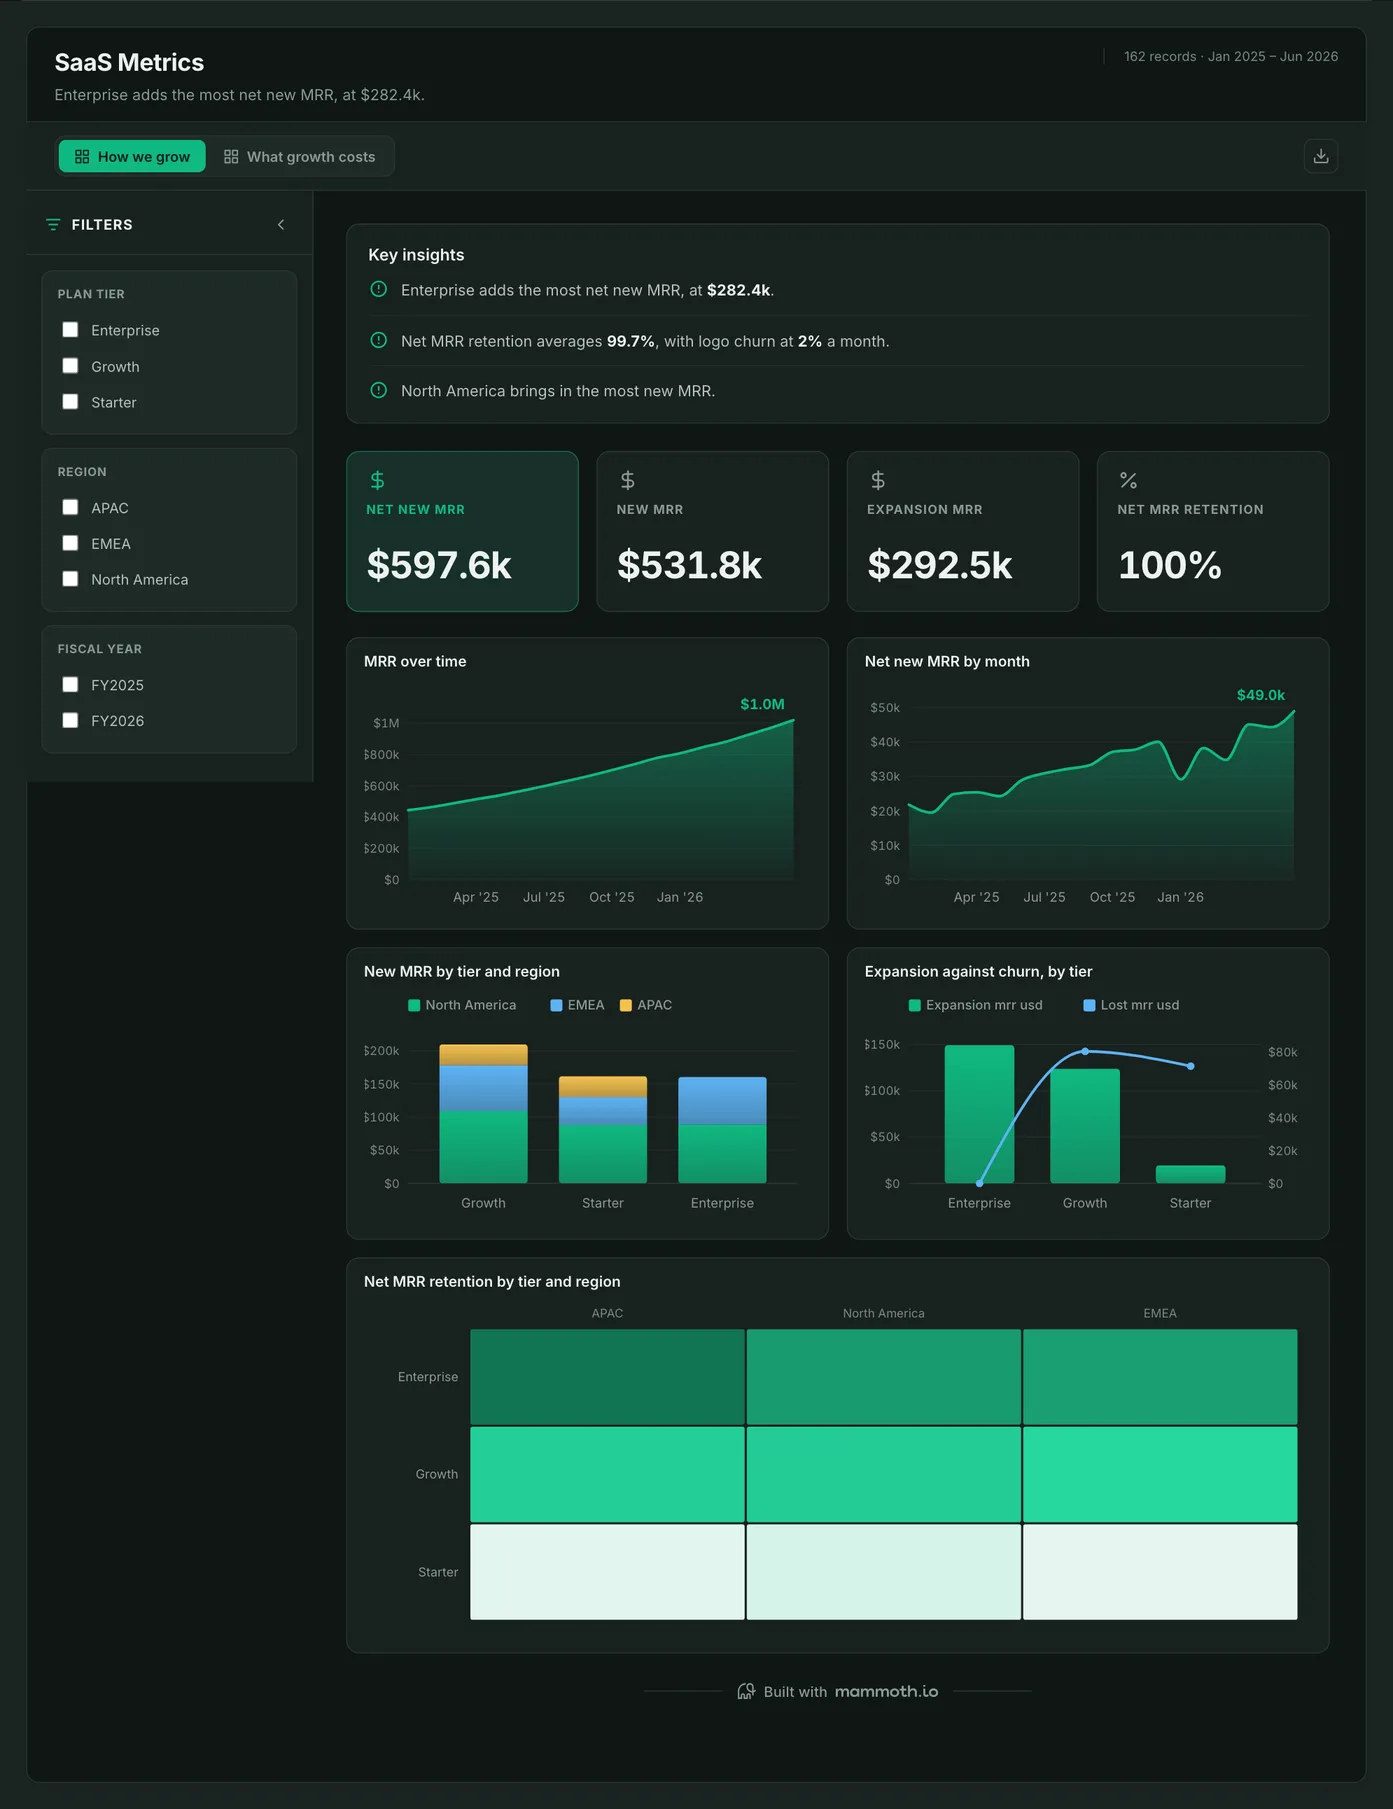
SaaS KPI dashboard
Is recurring revenue growing, and is it staying?
MRR, net new MRR, new MRR and net MRR retention on the strip, then growth by plan tier and region. The four a subscription business is judged on, with expansion set against churn so a good month can be told from a lucky one.
What is on it· 2 pages · How we grow / What growth costs
- MRR over time
- Net new MRR by month
- New MRR by tier and region
- Expansion against churn, by tier
- Net MRR retention by tier and region
Your data needsDashboard
- a revenue or money column
- a category (~3 values)
Sample data: illustrative figures, not business results. Example 06· Template: Project Portfolio
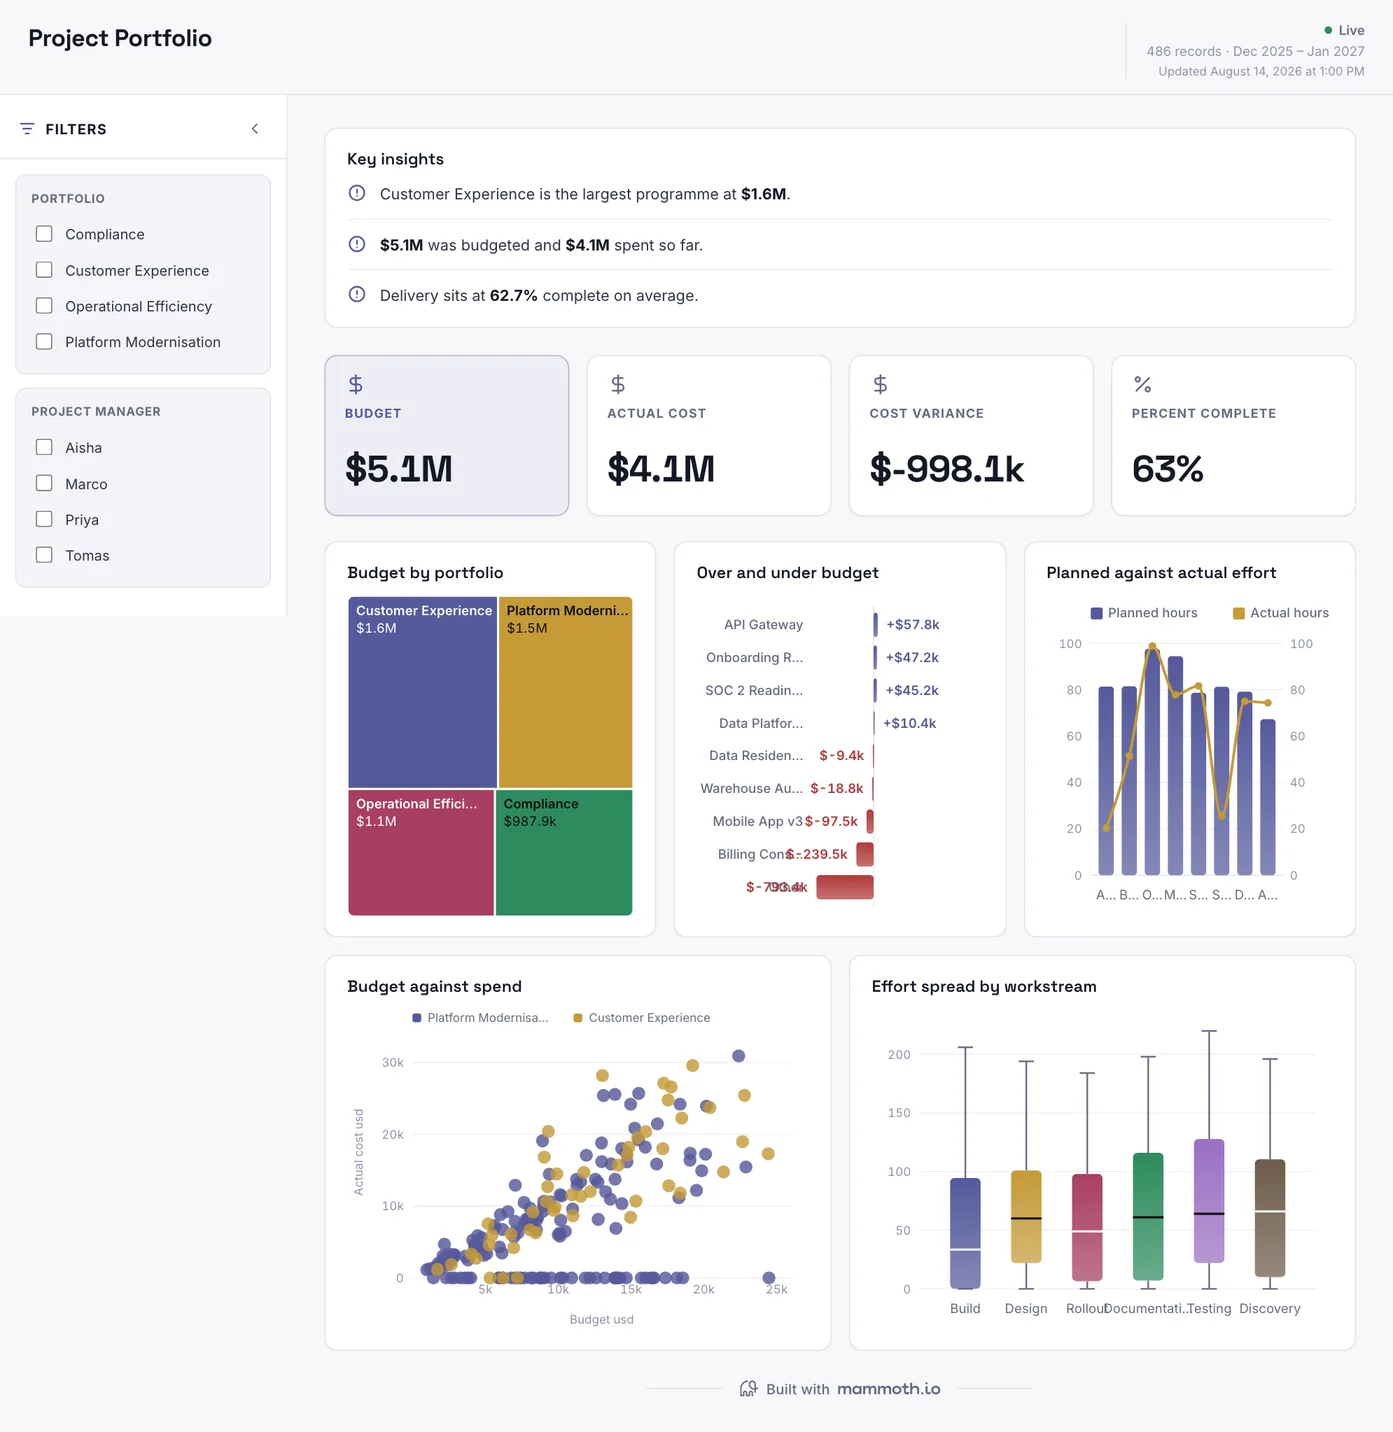
Project KPI dashboard
Which projects are over budget, and how far along are they?
Budget, actual cost, cost variance and percent complete on the strip, then each programme on its own line. Progress and cost sit side by side because a project 80% done on 130% of its budget is not good news.
What is on it
- Budget by portfolio
- Over and under budget
- Planned against actual effort
- Budget against spend
- Effort spread by workstream
Your data needsDashboard
- a revenue or money column
- a category (~4 values)
Sample data: illustrative figures, not business results.
The metrics
KPI examples, and what each one needs
Eight KPIs that recur across the six boards above, one or two per function. The last column is where a KPI dashboard goes wrong: the arithmetic is easy, the definition is not.
| Metric | What it answers | What your data needs |
|---|---|---|
| Revenue against target | Is the business where it said it would be? | Actuals and the plan at the same period and account level. A yearly plan read against monthly actuals is the usual reason this looks wrong. |
| Gross margin | What is left after the cost of delivering the revenue? | Revenue and cost of sales for the same period, with one agreed rule for which costs count as direct. |
| Win rate | Of the deals decided, how many did we win? | Closed-won and closed-lost on one definition of closed, over the same window. Leaving out deals that went quiet inflates it. |
| Customer acquisition cost | What does it cost to win a customer? | Sales and marketing spend for the period divided by new customers in it, with people costs included. Ad spend alone makes it look cheap. |
| Net revenue retention | Do existing customers spend more or less over time? | Recurring revenue from the same customers at both ends of a year, with new customers kept out. |
| Employee turnover | Are we losing people faster than we were? | Leavers over average headcount for the same rolling window. A monthly rate on a small team swings on one resignation. |
| Cost variance | Which projects are spending more than planned? | Budget and actual cost per project, shown one by one. Netted to a total, one overrun hides behind one underspend. |
| Return on ad spend | What does each unit of ad spend bring back? | Spend per channel joined to the revenue it drove, on one definition of a conversion across every platform. |
From example to live dashboard
Pretty is easy. Current and true is the hard part.
Any of these can be drawn in a slide. What makes one worth keeping is the five steps underneath it, and they are the same five whichever example you start from.
- 01
Connect the source
The dashboard reads the system, not an export somebody saved to their desktop. 100+ tested connectors, plus anything with a REST API.
- 02
Prepare it once
Cleaning, joining and reshaping are recorded as steps you can read, change and re-run, not a formula buried three sheets deep.
- 03
Check it before anyone sees it
Data checks run with the refresh and flag the rows that fail, so a broken upstream file shows up as an alert rather than as a wrong number in a meeting.
- 04
Put it on a schedule
Refresh on a schedule and the dashboard stays current on its own. Starter refreshes weekly, Team daily, and Pro every three hours.
- 05
Publish it and send the link
Public, password-protected or sign-in only. Every sharing mode is available on every plan, including the free one.
Sharing
Everyone can see it.
Nobody pays to look.
Most dashboard tools charge for every person who opens one, which is why so many dashboards end up as a screenshot pasted into a message. Mammoth charges for the people who build. Viewers are unlimited and free on every plan, including the free one.
You pay for
The people who build
Anyone connecting a source, preparing data or publishing a dashboard counts as a platform user.
You never pay for
The people who look
Viewers are unlimited and free on every plan, including the free one. A board, a client list or a whole company: the number does not change the bill.
Plans differ in how many builders and published dashboards a workspace gets. Drafts, viewers and every sharing mode are unlimited and free on all four. Full pricing.
KPI dashboard questions
How many KPIs should one dashboard show?
What is the difference between a KPI and a metric?
What are the four types of KPI dashboards?
How do I build a KPI dashboard?
- List the decisions the review makes, and keep only the KPIs a decision hangs on: five to ten at most.
- Give each KPI a target and a definition that everyone signs off before it goes on a screen.
- Connect the systems the numbers live in and prepare each into its own dataset.
- Put the KPIs on the strip with their direction and the target beside them, and the cut that explains each one underneath.
- Schedule the refresh and share the link, so the review opens on this week's numbers.
What are the main KPIs to track?
What is the difference between a KPI dashboard and a report?
Where does the data for a KPI dashboard come from?
How do I stop the numbers going stale?
Can I share it with people who do not build dashboards?
Last reviewed against the template catalogue.
Build the KPI dashboard you actually need.
Connect a source, prepare it once, and publish. Everyone who needs to see it can, at no per-viewer cost.
- 14-day Pro trial
- No credit card
- Viewers always free