How to
Add next month, and your dashboard follows
38 seconds, real app, made-up orders. The dashboard stays a draft; nothing is published. Follow along with the same two: Orders, July to September (CSV) and Orders, October (CSV). Download the video (MP4)
The steps
- 1
Start from your dashboard
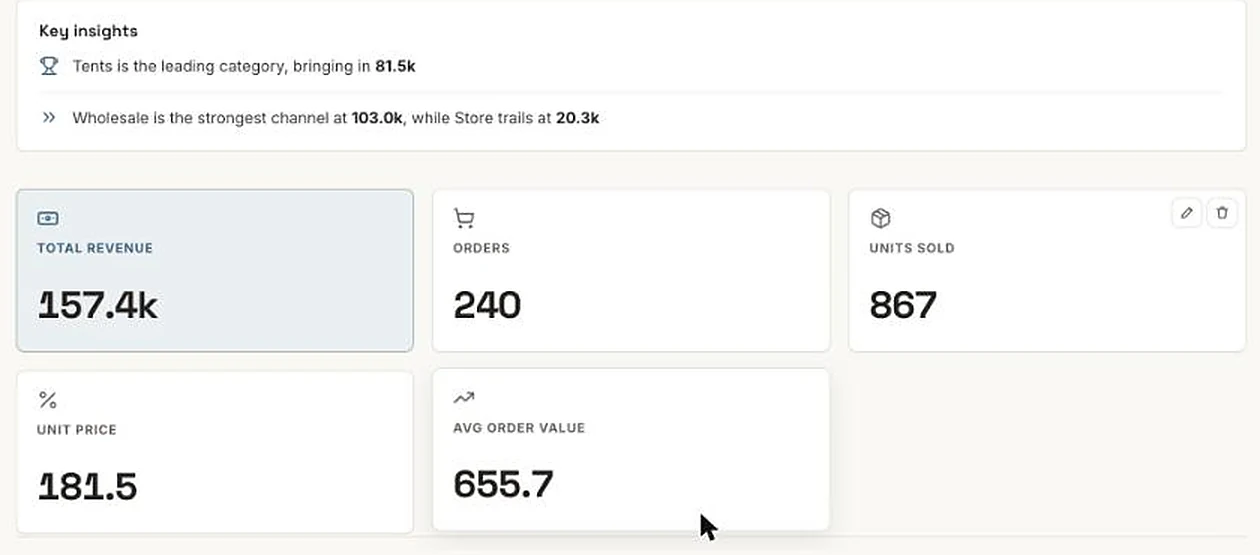
Here, a revenue dashboard built on July to September: 240 orders and 157.4k in revenue.
- 2
Open the dataset behind it
In Data, select the dataset the dashboard is built on. Its panel says which dashboards it feeds.
- 3
Add next month's file
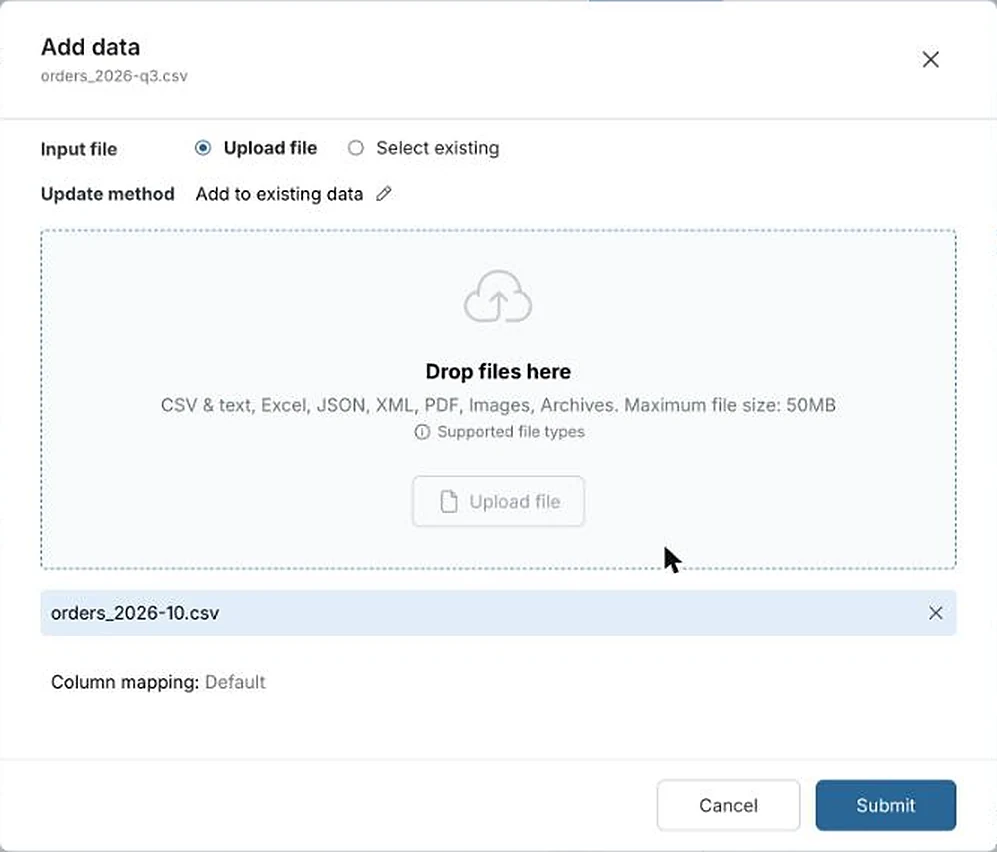
Choose Add data and upload the new file. Leave the update method on Add to existing data so the earlier months stay. Choose Submit. The dataset now has 325 rows, in 2 batches, and any steps on it run on the new rows too.
- 4
Open the dashboard
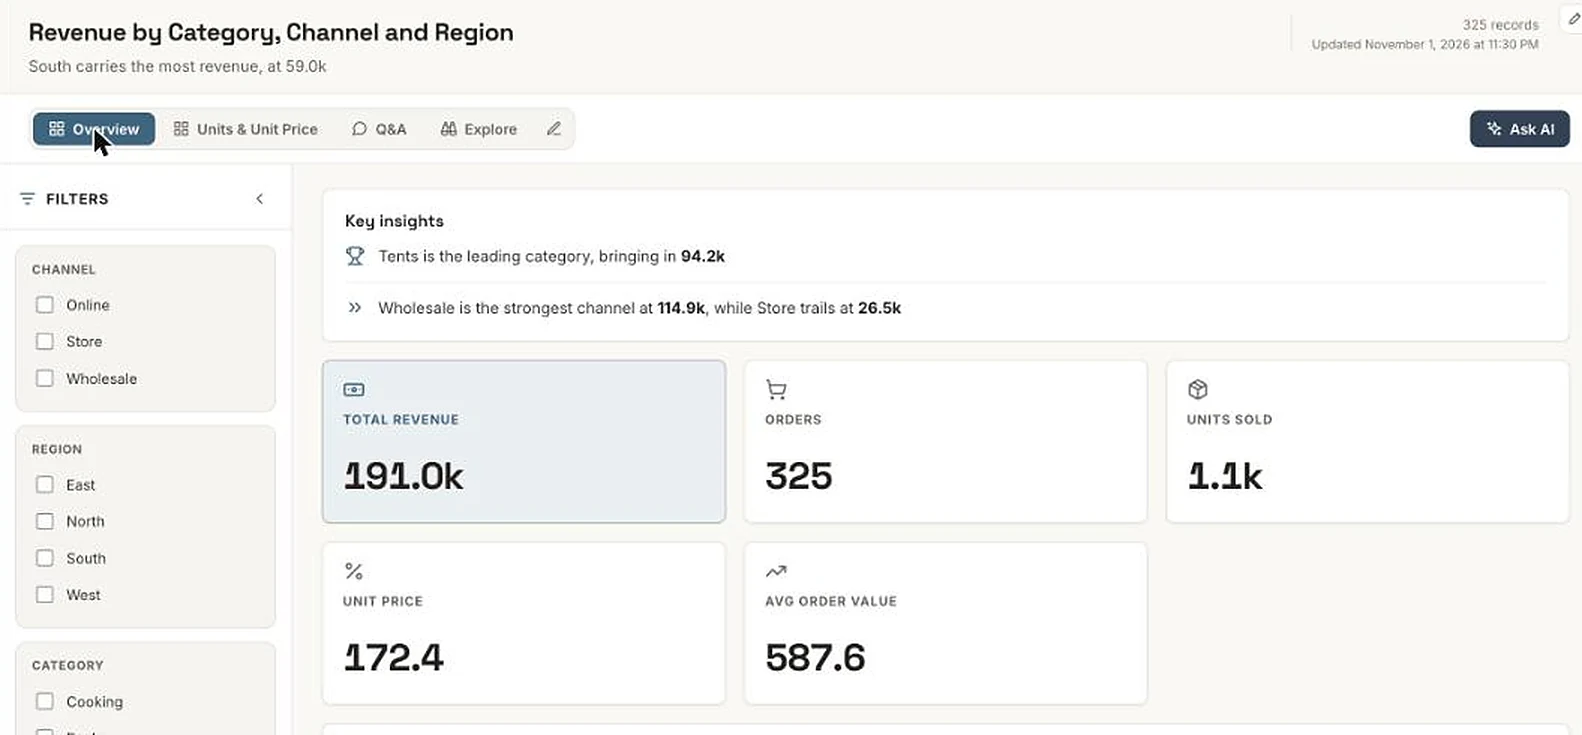
Nothing to rebuild. The totals include October: 325 orders and 191.0k. The Order date filter now runs to 31 October, and the headline and key insights are updated. Check one total against your files.
What carries over
When you add data to a dataset:
- Every step on the dataset runs again, on old and new rows
- Dashboards built on it show the new rows when you open them
- Each upload is kept as its own batch in Settings & history
On Free you add each month by hand, and up to 3 dashboards stay live for your viewers. Paid plans can pick up new files from a folder or refresh on a schedule.
If it doesn’t look right
- The new month isn't on the dashboard
- Check the file went into the dataset the dashboard is built on: its panel says which dashboards it feeds. Then check the row count went up.
- The totals doubled
- You probably uploaded a file that repeats earlier months. Open Settings & history on the dataset and check the batches. Rows in a suspended batch don't count on dashboards, so suspend the duplicate one.
- The columns changed this month
- If the new file's columns don't match, Mammoth asks before adding it, so you can match them up.
Share it
More how-tos
- Tell it what to pull, in plain wordsName the fields you want from an invoice PDF and get them as one row.
- Put two files on one dashboardJoin sales to targets on the store they share and chart them side by side.
- Describe the change, skip the formulaSplit a name column into first and last by saying so, then check the preview.
- Next month's file, same stepsAdd next month's file and every cleaning step runs again; a changed layout stops to ask.
- Next month's statement, zero reworkRead a PDF statement once; next month's goes through the saved recipe into the same columns.
- Share it with the whole team, no seats to buyPublish a dashboard and send the link; viewers are free on every plan.
- Every table in your PDF, joined into oneTables that share columns come back as one dataset, even across pages.
- Describe a dashboard, get one built from your dataPick one of the dashboards Mammoth suggests from your columns, or describe your own.
- Drop in your messiest spreadsheetStacked headers, merged cells and subtotals, turned into a clean table you check first.
- Let viewers ask their own questionsThe Q&A page answers viewers' follow-ups from the data, with the source and a CSV.
- Scans and phone photos work tooMammoth reads documents with no text layer, such as scanned PDFs and photos of receipts.


Try it with next month's file.
Open the dataset, choose Add data, then check a total on the dashboard.
- ✓ 14-day Pro trial
- ✓ No credit card
- ✓ Viewers always free