How to
Describe a dashboard, get one built from your data
56 seconds, real app, made-up orders. The dashboard stays a draft; nothing is published. Follow along with the same file: Orders, July to September (CSV, 240 rows). Download the video (MP4)
The steps
- 1
Add your data
In Data, choose New dataset and upload your file. Here, 240 orders with a date, channel, region, category, product, units and revenue.
- 2
Pick a starting point
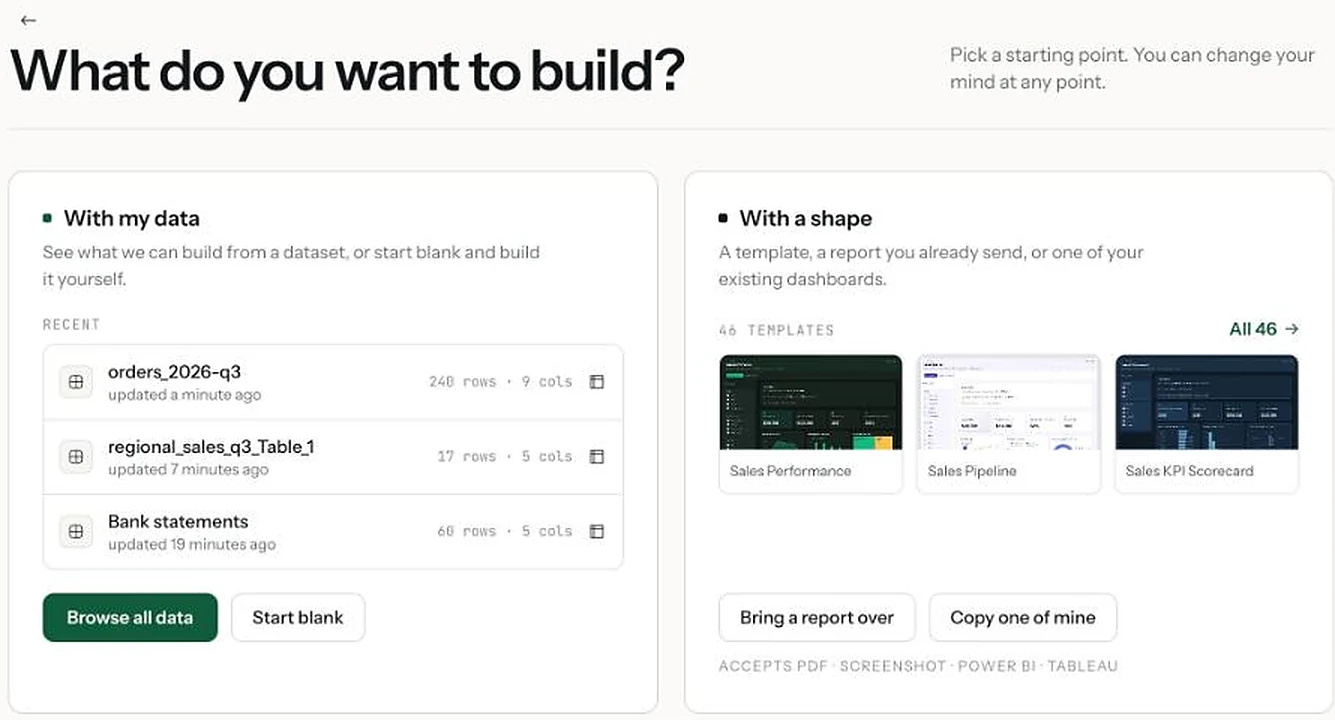
Go to Dashboards and choose Create. Start from your data by picking a dataset, or from a template, a report you already send, or one of your dashboards.
- 3
Choose an idea, or describe your own
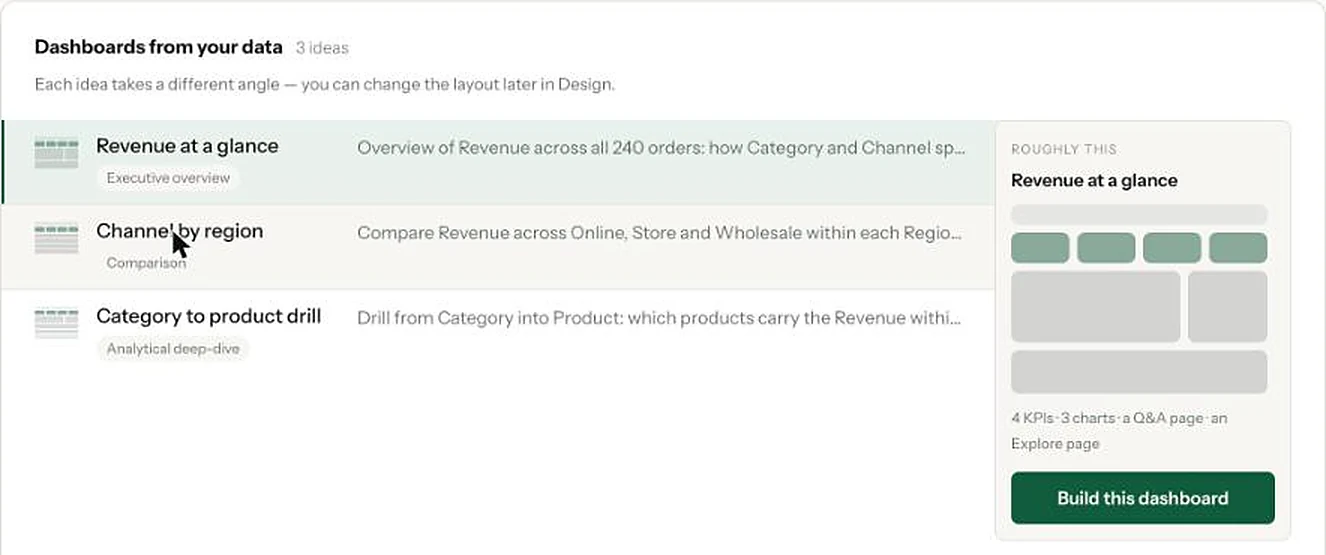
Mammoth reads your columns and suggests three dashboards, each from a different angle, with a sketch of the layout. Choose one and Build this dashboard, or type the dashboard you want in the box underneath.
- 4
Check the board
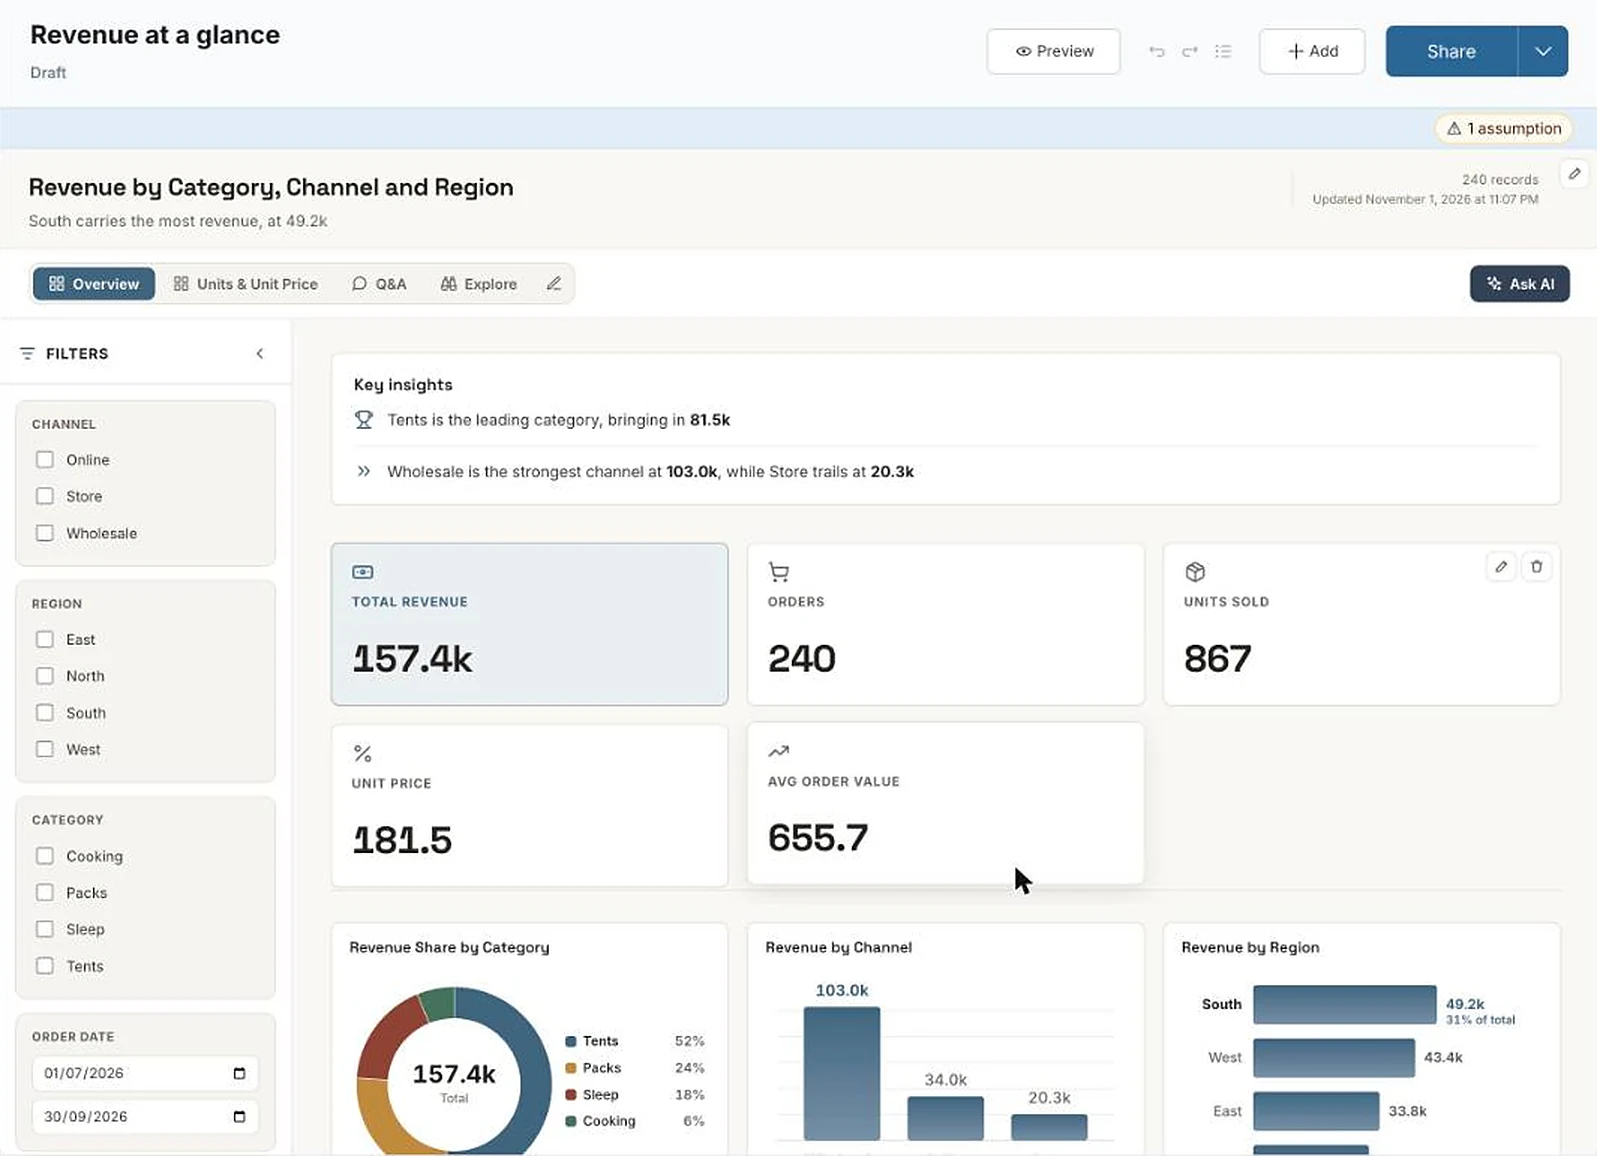
In about a minute you have the whole board as a draft: totals, charts, filters, and Q&A and Explore pages. The numbers are calculated from your rows, so check one you know. Here, 157.4k is the file's total revenue.
- 5
See what it assumed
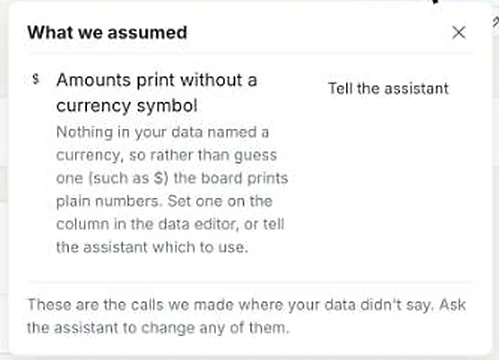
Where your data doesn't say something, the board tells you what it assumed. Here, no column named a currency, so amounts show without a symbol. Ask the assistant to change it.
- 6
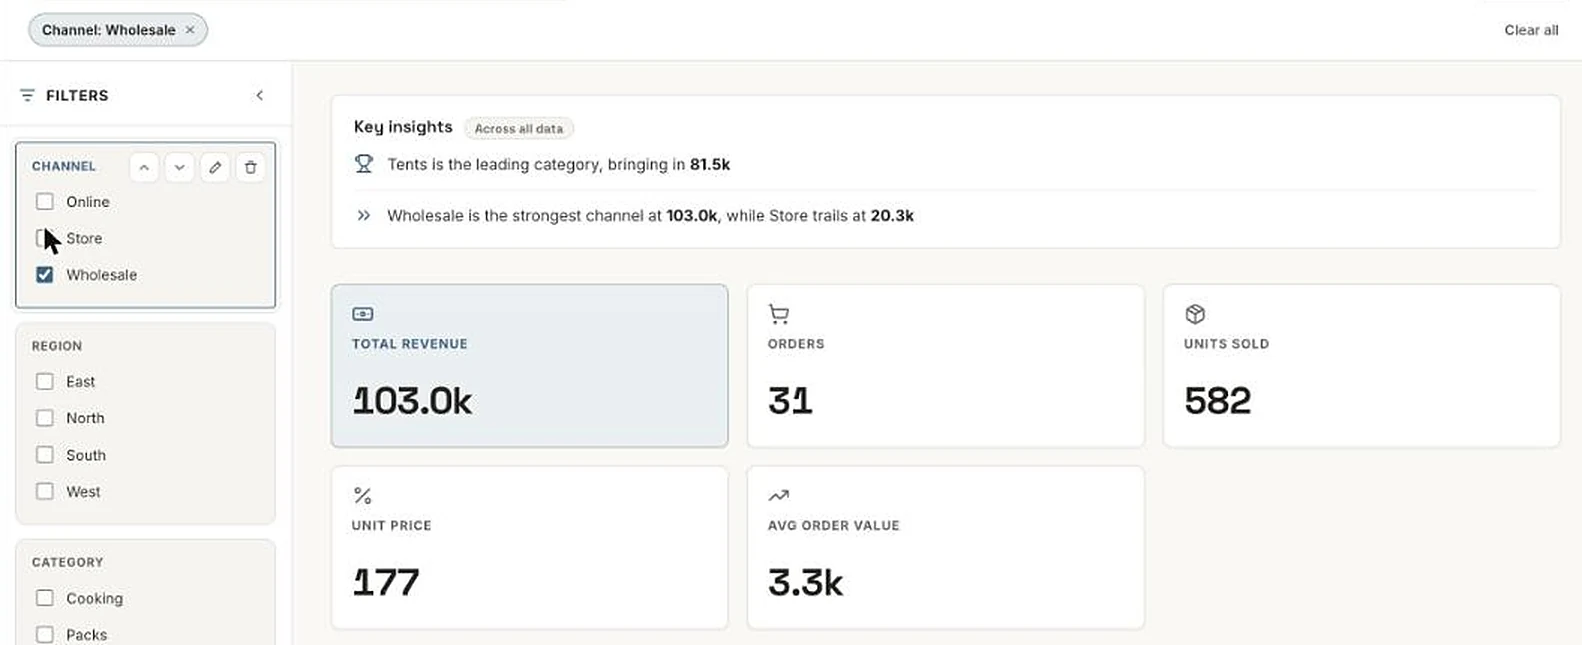
Filter it
Tick a filter and the totals and charts are recalculated. Wholesale only: 103.0k from 31 orders.
Dashboards you can describe
If none of the ideas fit, say who it's for and what they need to see.
- Revenue by month and channel, with the top 10 products
- A weekly board for store managers: orders, units and returns by store
- Compare regions: revenue, average order value and growth
Once it's built, ask for changes in the chat beside the board, such as “make the bars blue” or “add a page on returns”.
If it doesn’t look right
- A number looks wrong
- Check what the card adds up and which column it uses. A card that should count orders should count Order ID, not add up revenue. Ask the assistant to change it, and check again.
- Amounts show without a currency
- Open the assumptions note at the top of the board and tell the assistant which currency to use, or set it on the column.
- A column is missing from the charts
- The board uses the columns the data had when it was built. If you add a column later, such as revenue from units × price, ask the assistant to use it.
Share it with your team
More how-tos
- Tell it what to pull, in plain wordsName the fields you want from an invoice PDF and get them as one row.
- Put two files on one dashboardJoin sales to targets on the store they share and chart them side by side.
- Describe the change, skip the formulaSplit a name column into first and last by saying so, then check the preview.
- Next month's file, same stepsAdd next month's file and every cleaning step runs again; a changed layout stops to ask.
- Next month's statement, zero reworkRead a PDF statement once; next month's goes through the saved recipe into the same columns.
- Share it with the whole team, no seats to buyPublish a dashboard and send the link; viewers are free on every plan.
- Every table in your PDF, joined into oneTables that share columns come back as one dataset, even across pages.
- Drop in your messiest spreadsheetStacked headers, merged cells and subtotals, turned into a clean table you check first.
- Let viewers ask their own questionsThe Q&A page answers viewers' follow-ups from the data, with the source and a CSV.
- Scans and phone photos work tooMammoth reads documents with no text layer, such as scanned PDFs and photos of receipts.
- Add next month, and your dashboard followsUpload the new month to the same dataset and every chart picks it up. Works on Free.


Try it with your own data.
Upload a file, choose Create in Dashboards, and pick a starting point.
- ✓ 14-day Pro trial
- ✓ No credit card
- ✓ Viewers always free